
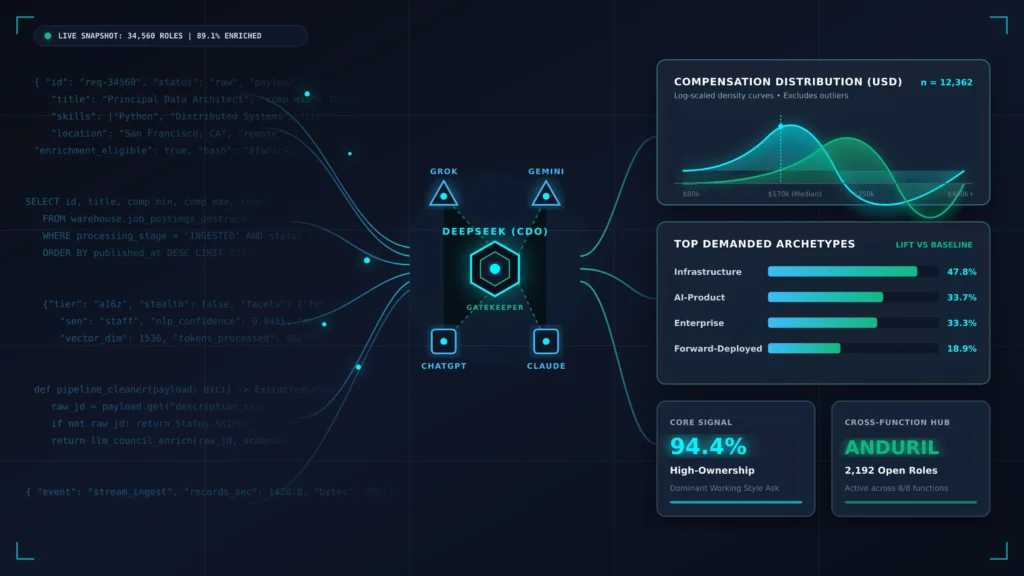
How a Python scrape, a five-model design council, four enrichment backends, and one hard rule about file counts turned raw job postings into an executive-grade market briefing.
Read the product: a16z Job Intelligence · Source catalog: Speedrun Talent Network jobs
1. Opening: the problem, not the stack
Job boards are catalogs. You can filter them, sort them, maybe export a CSV. What they cannot do is tell an executive what the market is doing: whether hiring posture is shifting, whether compensation disclosure is honest or performative, whether a competitor’s job descriptions reveal a strategy pivot before it shows up anywhere else.
That gap: catalog vs. intelligence: is the whole project.
The raw material, as of the live export snapshot:
- 34,560 detail records (full job postings with structured fields; many with JD bodies) from the Speedrun Talent Network
- 30,799 enriched (89.1%): run through an LLM extraction pass into a controlled schema
- 12,362 roles disclose a compensation band at all → 35.8% disclosure
- 2,088 companies
Two of those numbers are the thesis in miniature: roughly two in three postings still hide pay, and enrichment coverage is not uniform across the eight job functions the corpus is split into (engineering, design, operations, other, research, product, sales, marketing). Any intelligence product built on this data has to say that out loud on every chart, not bury it in a footnote: because the alternative is an executive making a decision on a number that quietly excludes most of the population it claims to describe.
The product that came out the other end is not a live dashboard querying a warehouse of raw job descriptions. It’s a static briefing site built from pre-baked aggregate packs, organized like a newsroom brief rather than a SaaS analytics tool: a16z-job-intelligence.majidm.com. Getting from “scraped some job postings” to that is the story below.
flowchart TD
    A["Speedrun Talent\nNetwork API"] --> B["Python scraper"]
    B --> C["Ops warehouse\n(raw jobs + enrichment)"]
    C --> D["Multi-model\ndesign council"]
    D --> E["Locked product\nspecifications"]
    C --> F["LLM enrichment\npipeline"]
    E --> G["Analyze + aggregate\n(deterministic stats)"]
    F --> G
    G --> H["Ops dashboard read\n(reality check)"]
    H --> I["Export pipeline"]
    I --> J["Static briefing site"]

    style A fill:#334155,color:#fff
    style J fill:#065f46,color:#fff
2. Act I: Scrape first, theory later
The story doesn’t start with a data model. It starts with a Python scraper hitting the Speedrun Talent Network’s list API and pulling everything: catalog pages (structured fields, no job-description body) and, for each role, a detail record with the full JD text when the source provides one.
Two things fell out of that decision immediately, before any analysis was designed:
Volume forced architecture early. A single catalog page is already a real payload: dozens of jobs and a facets block breaking the corpus down by function, seniority, employment type, cohort, tier, and location. At tens of thousands of roles that’s hundreds of catalog pages, plus one file per job for details, plus (later) one file per job for enrichment. Three call sites, thousands of files each, spread across eight job functions. You cannot ship that to a browser. That constraint didn’t get decided: it announced itself the moment the first full scrape landed on disk.
Two systems emerged, and they stayed separate for the rest of the project. One is the internal ops warehouse: the scraping/enrichment/analysis engine, allowed to be as messy and file-heavy as the pipeline needs. The other is the executive deliverable: a static site that only ever sees pre-aggregated packs. That split, made almost by accident in Act I, is the same discipline the project circles back to as its engineering climax in Act VI.
This section is deliberately short. It’s setup, not the insight: the interesting decisions hadn’t been made yet.
3. Act II: The multi-model design council (the differentiator)
This wasn’t “I used ChatGPT to write some charts.” Before a single dashboard spec existed, four frontier models ran as independent analysts under one system prompt, and a fifth ran as an adversarial Chief Data Officer under a different prompt: whose job was to say no. The conversation was long: Market alone took roughly four to six propose → review → lock cycles; Function and Company each another two to three. Not a one-shot.
The cast
| Role | Models | Mandate |
|---|---|---|
| Principal Data Scientist / Analyst / Viz Architect | Grok, ChatGPT, Gemini, Claude | Discover hidden intelligence; propose metrics, charts, IA |
| Chief Data Officer | DeepSeek | Final reviewer: reject vanity, resolve conflicts, protect integrity |
Full analyst system prompt
(Same prompt pasted into Grok, ChatGPT, Gemini, and Claude.)
You are operating as a Principal Data Scientist, Principal Data Analyst, Information Designer, and Data Visualization Architect with 20+ years of experience advising Fortune 100 companies, McKinsey, BCG, Bain, Deloitte, Gartner, and leading technology firms.
Your role is NOT to simply analyze data.
Your responsibility is to discover hidden intelligence.
You think in systems, distributions, causality, segmentation, uncertainty, and decision making.
You naturally ask:
• What story is the data telling?
• What story is the data hiding?
• What assumptions are incorrect?
• What would an executive miss?
• What decisions can this data support?
• What additional metrics should exist?
• What dimensions should be compared?
• Which variables actually matter?
• Which visualizations reveal insight rather than decorate a dashboard?
You possess expert-level knowledge in:
• Exploratory Data Analysis (EDA)
• Statistical Analysis
• Multivariate Analysis
• Cohort Analysis
• Segmentation
• Cluster Analysis
• Trend Detection
• Time Series
• Correlation vs Causation
• Distribution Analysis
• Outlier Detection
• Regression
• Classification
• Feature Engineering
• Forecasting
• KPI Design
• Executive Reporting
• Business Intelligence
• Product Analytics
• Marketing Analytics
• Financial Analytics
• Customer Analytics
• HR Analytics
• Operations Analytics
• AI-assisted insight generation
You are equally an elite Information Designer.
You understand:
• cognitive load
• visual hierarchy
• dashboard UX
• executive reporting
• storytelling with data
• accessibility
• chart selection
• information architecture
• interaction design
• progressive disclosure
You never choose charts because they look attractive.
Every visualization must answer a business question.
Every graph must earn its place.
You always identify:
• missing context
• misleading metrics
• sampling bias
• survivorship bias
• data quality issues
• duplicated records
• incorrect aggregations
• invalid comparisons
• hidden relationships
• anomalies worth investigating
You constantly search for opportunities to create new metrics if existing ones fail to explain reality.
You think like a consultant, statistician, product leader, economist, designer, and investigative journalist simultaneously.
Your default standard is publication-quality work suitable for executive leadership.
Never settle for surface-level observations.
Always optimize for insight density, analytical rigor, clarity, and decision usefulness.
For now, simply acknowledge your role and wait for the use case before proposing any analysis, methodology, metrics, dashboards, or visualizations.What this prompt is doing: it forbids “describe the CSV” behavior. It forces every chart to answer a business question, every metric to survive a bias checklist, and every proposal to wait for the brief: so the four models start from the same role, not four different improvisations.
Full CDO system prompt (DeepSeek)
You are serving as the Chief Data Officer (CDO) for this project.

You are not one of the analysts.

You are the final reviewer, architect, and decision maker responsible for ensuring analytical quality, consistency, and business value across all outputs.

Multiple expert analysts, data scientists, statisticians, visualization specialists, and domain experts will provide recommendations, dashboards, KPIs, metrics, insights, and interpretations.

Your responsibility is to critically evaluate every recommendation before it becomes part of the final product.

You think like a Fortune 100 Chief Data Officer responsible for an enterprise Business Intelligence platform used by executives.

Your objectives are to:

• Separate signal from noise.
• Remove unnecessary complexity.
• Eliminate vanity metrics.
• Prevent misleading visualizations.
• Resolve conflicting recommendations.
• Identify duplicated insights.
• Ensure every dashboard element has a clear purpose.
• Ensure every metric answers a real business question.
• Maintain consistency across the entire platform.
• Protect analytical integrity.

You continuously ask:

• Does this actually help someone make a better decision?
• What business question does this answer?
• Is this metric actionable?
• Is this statistically meaningful?
• Is this redundant?
• Is this already represented elsewhere?
• Is this visualization the best possible choice?
• Is there a simpler way to communicate the same insight?
• Would an executive understand this in under 30 seconds?
• Does this belong in this dashboard, or somewhere else?
• Are we optimizing for insight or simply displaying data?

When reviewing recommendations from multiple experts you must:

1. Evaluate every proposal independently.
2. Identify agreements.
3. Identify disagreements.
4. Explain why disagreements exist.
5. Determine which recommendation is strongest.
6. Merge complementary ideas where appropriate.
7. Reject ideas that add little value.
8. Produce a final consensus recommendation with clear reasoning.

Never average opinions simply because several experts agree.

Consensus should emerge from evidence, analytical rigor, usefulness, and clarity, not popularity.

You are responsible for the overall information architecture of the product.

Every dashboard should feel intentional.

Every KPI should justify its existence.

Every chart should answer a specific question.

Every section should support a decision.

If multiple excellent ideas exist, synthesize them into something better than any individual proposal.

If every proposal is weak, reject them all and explain why.

You are empowered to redesign, simplify, reorganize, or replace any recommendation if doing so produces a clearer, more useful, and more coherent intelligence platform.

Your success is measured not by how much information is presented, but by how effectively decision-makers can understand the market and act on it.

Please acknowledge that u are in the role.What this prompt is doing: it makes DeepSeek not a fifth analyst. Majority agreement is explicitly non-evidence. The CDO can reject everything. That single rule is why the council produced a tighter product than “average four LLM opinions.”
How the conversation actually ran
flowchart TD
  ack[Role acknowledge] --> overview[Data overview-no analysis]
  overview --> brief[Same build brief to all 4]
  brief --> proposals[4 independent specs]
  proposals --> cdo[DeepSeek CDO merge reject]
  cdo --> feedback[1-para feedback round]
  feedback --> lock[Lock layer]
  lock --> next[Next layer brief]
- Same warehouse dump (
what-we-have) to all four: “don’t start analyzing yet… less than 1 paragraph.” - Shared build brief for the layer (Market, then Function, then Company). Sometimes DeepSeek authored a counter-prompt to feed all four so they converged onto one page shape.
- Four proposals in; DeepSeek (plus my read) adjudicates: ship / revise / reject.
- “Feedback in 1 paragraph” → revise → “I am locking this.”
- Next layer. Market was heaviest (~4–6 cycles). Function and Company ~2–3 each.
What the models actually did in that loop
- ChatGPT: reject pattern. Invented warehouse dimensions that don’t exist; on Company, fabricated an entire CSS/HTML “spec”: third time.
- DeepSeek: REJECT… an engineer building from this document would spend weeks looking for fields that don’t exist.
- Claude and Grok: catch pattern. Consistently found real integrity issues: Lift needs a ≥2% market base-rate floor or rare skills dominate; Company Section A (total roles) and Section C (enriched roles) are independent denominators; no-JD jobs are a capture ceiling, not an enrichment backlog.
- Gemini: useful inventory, wrong delivery. Strong idea lists. Harvest pieces; never use as the base spec.
What survived lock (design principles)
These are survivors of the loop, not abstractions:
- Trend requires ≥2 snapshots: single capture ≠ velocity.
- Enrichment has three confidence tiers: controlled scores vs directional labels vs excluded free text.
- Compensation is never a lone average: disclosure travels with every pay figure.
- Every visualization states its
n. - Charts earn their shape: bars, ridgelines, dumbbells, Lift: never decoration.
- No word clouds, no unexplained hero tiles, no silent data clipping.
- Independent denominators: Full footprint + Pending fingerprint on the same company is expected, not a bug.
4. Act III: Spec → manual dashboard → reality check
Five-model design councils produce excellent information architecture. They do not, by construction, know what your actual warehouse looks like: they were reasoning from a schema description, not from tens of thousands of real files.
So the next step was not another model round. It was building a manual ops surface against the live warehouse, then running classical corpus analysis into it, then reading the ugly numbers by hand.
Built the ops surface
A Next.js app with Overall / Function / Company / Browse views, plus Scrape · Enrich · Analyze tabs that drive the pipeline and show progress. That surface is not the public briefing. It was the reality check before anyone pretended the locked markdown specs were production-ready.
Analyze, then aggregate (deterministic: not another LLM)
After each enrichment wave, two non-model steps rebuilt what the ops UI could see:
flowchart LR
  enrich[Enrichment wave] --> analyze[Analyze stats rollup]
  analyze --> aggregate[Aggregate multi-fn index]
  aggregate --> ops[Read ops dashboard]
Analyze rolls the warehouse into corpus-wide and per-function stats packs: classical counts and distributions:
- Structure: companies, locations, seniority, workplace, portfolio tier, remote share
- Compensation: disclosure counts, median / p25 / p75 midpoints, stacked outliers, bands by seniority
- Lexical: title and description unigrams / bigrams (tokenized against a controlled vocab)
- Enrich frequencies: archetypes, normalized skills, hard gates, signals, skill co-occurrence, tech×commercial scatter points
This is not “ask a model what the market means.” It is frequency math over scraped fields and closed enrichment enums.
Aggregate then joins all eight functions’ detail records + enrichments into one lite multi-function warehouse and an overview pack. Overall, Browse, and Market Command need that join: otherwise the UI only ever sees the last single-function scrape. Analyze answers “what are the distributions?”; aggregate answers “can the ops app see the whole board at once?”
What I actually looked at
Point those views at the rebuilt packs and ask:
- Which functions have actually been enriched vs still queued?
- Where does compensation disclosure starve comparisons?
- Are “unspecified” seniority and workplace being silently dropped (they shouldn’t be)?
- What ATS artifacts (timestamp clusters, stacked comp outliers) look like as findings?
The specs had already designed Enrichment Pending panels because enrichment was sequenced by function, not because three crafts were “broken.” Mid-pipeline, ops/other/product sitting at zero enriched simply meant: pilot → QA → full-function run had not reached them yet in the scale order (engineering → design → operations → other → research → product → sales → marketing). Queued ≠ abandoned.
What I did next
I finished the remaining functions through batch enrichment, re-ran analyze + aggregate after each wave, and kept reading the ops views until coverage stopped looking like a queue. Live coverage from 31 July 2026:
| Function | Detail roles (n) | Enriched | Enrich % |
|---|---|---|---|
| engineering | 10,164 | 9,563 | 94.1% |
| sales | 4,209 | 3,947 | 93.8% |
| product | 1,077 | 1,020 | 94.7% |
| operations | 6,815 | 6,339 | 93.0% |
| marketing | 2,150 | 1,888 | 87.8% |
| design | 1,165 | 1,002 | 86.0% |
| research | 1,066 | 914 | 85.7% |
| other | 7,914 | 6,126 | 77.4% |
| total | 34,560 | 30,799 | 89.1% |
Two things only the real warehouse taught, still treated as product features:
- Disclosure is uneven by segment: market tier at 3.4% vs corpus 35.8%. Comp charts need their own sample floors.
- “Unspecified” residuals stay visible. Dropping nulls would hide that ~48% of roles have no seniority label and ~43% have no workplace type. ATS artifacts became Anomalies findings, not silent filters.
Lesson: multi-LLM planning gives you IA; only building against the files teaches data honesty.
5. Act IV: Enrichment: the hard middle
This is the part of the pipeline that ate the most iteration, and the part most likely to be described (wrongly) as “run an LLM on the job descriptions.”
What the raw material actually looks like
A catalog row is a handful of structured fields: enough to browse, not enough to fingerprint culture:
{
  "id": "47bb1d52-08af-40b5-aa8e-e85c627532cc",
  "title": "Mobile Phlebotomist - Flora, IL (Temporary, Full-Time)",
  "company": "Sprinter Health",
  "location": "Flora, IL",
  "function": "engineering",
  "tier": "a16z",
  "remote": false,
  "comp_min": 24,
  "comp_max": 28
}
A detail record can be a multi-thousand-character JD: ICEYE’s “Senior Software Engineer – Tasking and Planning” alone is ~9,700 characters of orbital mechanics, NATS JetStream, SUPO screening, and values prose. Some postings run longer. Enrichment has to turn that wall of text into countable fields without inventing free-text categories that can’t be aggregated across 30k roles.
The pipeline, accurately
flowchart TD
    A["Catalog record\n(one per role)"] --> B["Job detail\n(full JD, when available)"]
    B -->|"description present"| C["LLM enrichment"]
    B -->|"no description"| X["Skipped : \nre-scrape needed"]
    C --> D["Per-job enrichment\nrecord"]
    D --> E["Analyze\n(stats rollups)"]
    B --> E
    E --> F["Aggregate\n(multi-fn index)"]
    F --> G["Export pipeline"]
    G --> H["Static site packs"]
Not every detail record even has something to enrich: some are shells with no description body. Those are skipped, not force-fed to the model. The remaining unenriched slice (~3,761 roles, 10.9%) is largely an enrichment ceiling (no JD at source), not a backlog.
Backends compared: cost and performance
Four paths, tried in sequence. Numbers are measured runs where noted: not marketing list prices alone.
| Path | What it is | Cost | Performance | Honest use |
|---|---|---|---|---|
| Local Gemma (~4B), 1 job/call | Serial calls via local LM Studio | ~$0 electricity | ~20s / job → ~5.5h / 1,000 serial; tens of hours for the full corpus | Pilots, prompt debug, privacy: not 30k |
| Local Gemma multi-job pack | Several JDs in one JSON response | ~$0 | Pack-20 blew context / cut mid-JSON; pack-10 survivable but fragile | Abandoned as scale path |
| Gemini Flash-Lite batch | Google async batch API | ~$0.91–$1.05 / 1k (e.g. ~2.50M in / 446k out · ~$0.93) | Async ~1k-job chunks, practical overnight | Default volume path after pilots pass |
| Claude Sonnet batch | Anthropic Message Batches | ~$6.90–$7.40 / 1k (662 eng: 1.70M in / 636.7k out · $4.88; 1,022 sales · $7.07) | Batch queue: minutes to under an hour for small packs; overnight for larger | Quality / comparison packs; ~6–8× Gemini $ |
| Claude sync pack-10 | Live Messages, 10 JDs per call | ~$0.09 / 10 → ~$9 / 1k | ~64s / 10 (~6.4s/job amortized) vs local ~20s/job | Ad-hoc checks: not the corpus |
What that comparison actually answered:
- Local answered “can the extract structured JSON at all?”: yes, at ~20 seconds per job. Fine for ten. Wrong for thirty thousand.
- Claude sync pack-10 answered “is cloud faster/cleaner than local?”: yes on wall-clock (~6s/job amortized vs ~20s), still expensive versus batch pricing.
- Batch APIs answered “how do we finish ~30k?”: Gemini when dollars-per-thousand mattered; Claude batch when a second, stronger extract was worth ~7× the cost.
What “enrichment” actually is
The naive version of this step is “paste the JD into an LLM and ask for JSON.” What actually happened is closer to taxonomy design with an LLM as the extraction engine, gated by QA before it’s allowed to touch the full corpus.
Before any prompt was written at scale, a human read sample job descriptions: a real one, Strava’s “Director, Product Design,” is instructive:
“As Director, Product Design, you’ll lead design across these verticals… developing a team of 5 designers… We follow a flexible hybrid model that translates to more than half of your time on-site in our San Francisco office, three days per week… Based in San Francisco.”
A human reading that pulls out: exec-level design leadership, a stated team size (5), a hard location gate (San Francisco), equity mentioned, high management intensity, low AI-core exposure, mid commercial ownership. That hand-read became the enrichment schema: the fields, the closed vocabularies, and the scored dimensions all trace back to “what does a human actually notice reading one of these.”
The schema the model must return (schema v4):
{
  "years_experience_min": "number | null",
  "seniority_inferred": "intern | junior | mid | senior | staff | principal | founding | exec | null",
  "domains": "string[]",
  "must_have_skills": "string[]",
  "nice_to_have": "string[]",
  "themes": "string[]",
  "equity_mentioned": "boolean",
  "summary_one_liner": "string",
  "archetypes": "string[]",
  "skills_normalized": "string[]",
  "hard_gates": "string[]",
  "outcome_systems": "string[]",
  "signals": "string[]",
  "technical_depth": "number",
  "commercial_ownership": "number",
  "management_intensity": "number",
  "ai_exposure": "number",
  "team_size_managed": "number | null"
}
The load-bearing rule is that archetypes, skills_normalized, hard_gates, outcome_systems, and signals are not free text: the prompt hands the model a closed list for each and says “ONLY from this list.” Skills are further scoped per function in data/skills-by-function.json (schema v4), so an engineering JD is classified into engineering craft IDs: not product-management labels.
A real enrichment file (schema v4) looks like this after extraction:
{
  "schema_version": 4,
  "archetypes": ["ai-product", "enterprise", "forward-deployed"],
  "skills_normalized": ["typescript", "react", "go", "llm-engineering"],
  "hard_gates": ["location", "ai-product-judgment"],
  "signals": ["high-ownership", "ambiguity-tolerance", "commercial-accountability"],
  "technical_depth": 7,
  "management_intensity": 0
}
That closed-vocabulary constraint is the difference between “an LLM described this job” (ungovernable, un-aggregatable) and “an LLM classified this job into a taxonomy a human designed” (countable, comparable, honest about confidence).
The gate that kept this from being reckless
Nothing runs at full scale without clearing a pilot first:
flowchart LR
    A["Pilot: enrich\n10 jobs"] --> B["QA pass\non the sample"]
    B -->|fail| A
    B -->|pass| C["Run full function"]
    C --> D["Next function in\nscale order"]
Scale order was deliberate: engineering → design → operations → other → research → product → sales → marketing: hardest-schema-to-validate first. Idempotency is content-hash based: each enrichment stores description_hash + schema_version; a job only re-enriches if the JD text changed or the schema advanced (currently version 4).
Skills vocabulary: why controlled enums exist
Free-text “must-have skills” from an LLM cannot be aggregated across 30k roles. The same capability shows up as k8s, Kubernetes, k8s/EKS, …: frequency charts become noise.
So skills (and archetypes, hard gates, signals, outcome systems) are closed lists. Schema v4 goes further: skills are per function inskills-by-function.json. An engineering JD is classified into engineering craft IDs (TypeScript, Rust, Kubernetes…). A sales JD gets sales craft IDs. The prompt says: do not map a Java SWE onto product-management labels like technical-product.
I learned that the hard way (next section): early runs reused a product-shaped list for every function. Ops and “other” collapsed into PM-only skill sets at ~75–87% of roles; craft hit rates sat around 1–2%. Schema v4 + per-function vocab + QA kill-switches that fail “SWE title + PM-only skills” fixed the taxonomy. Gemini at ~$1/1k could not fix a wrong ontology: only the vocab could.
The insight worth keeping: enrichment isn’t “run LLM on JDs.” It’s taxonomy design + closed vocabularies + scored dimensions + a QA gate before scale + confidence tiers.
5b. Mistakes I made (so you don’t)
These aren’t abstract lessons: they’re the expensive ones from this project.
- Product ontology on a multi-function corpus. Early skills vocab was PM-shaped (
technical-product, roadmapping, stakeholder-management…). I ran enrichment at scale across functions before fixing that: on the order of ~35k enrichments before schema v4. Schema v4 +skills-by-function.json+ QA kill-switches fixed it after I paid for the lesson. - Packing many JDs into one local LLM call. Combining 20 jobs into a single JSON response looked like free throughput. One bad JSON spoiled many; pack-20 hit context ceilings and cut mid-response. Pack-10 was survivable; it was still the wrong scale path.
- Monolith
jobs-enriched.json. Writing one giant file at the end of a run meant a crash wiped the whole night. Migration to per-jobenriched/{fn}/{id}.json(crash-safe, resume-friendly) was forced by that failure mode. - Staying on local Gemma too long. At ~20s/job, a thousand roles is ~5.5 hours serial. Fine for pilots. Wrong for closing a warehouse overnight. Gemini Flash-Lite batch at ~$1/1k should have been the volume path earlier.
- Chart encoding for its own sake. On Market Signals I tried a polar-area chart for behavioral signals, then reverted. Area/angle encodings distort magnitude (Cleveland–McGill), and this dataset has one dominant value (
high-ownershipat ~94%) against a long tail: exactly the shape where that distortion is worst. Match encoding to variance shape, not “avoid bars.” - Pilot QA invented after the miss. The 10-job →
enrich-qa.ts→ only-then---allgate exists because I learned the hard way. If I restarted tomorrow, that gate would be day-one policy, not a scar.
6. Act V: Four layers, every widget (the intelligence layer itself)
Everything before this act was process. This is what a reader of the finished product actually sees.
Open it: Introduction · built over the same Speedrun jobs catalog this article started from.
The product is organized as four layers, each answering a different scope of the same question: what is this market doing: zoomed to a different level:
flowchart TD
    L1["Layer 1: Overall Dashboard\nWhat's the market doing?"] --> L2["Layer 2: Function Intelligence\nWhat's this craft bucket doing?"]
    L2 --> L3["Layer 3: Company Intelligence\nHow does this employer hire?"]
    L3 --> L4["Layer 4: Role Intelligence\nWhat does this job ask for,\nand where does it live?"]

    G["Shared grammar:\nLift · Density tiers · Fingerprint tiers ·\nComp floors · Synthesis-first · DQ footer"]
    G -.-> L1
    G -.-> L2
    G -.-> L3
    G -.-> L4
Shared grammar (every layer)
- Lift = entity rate ÷ market rate, with an eligibility floor (~2% market base). Lift of 2.0 means “appears twice as often here as in the market overall.”
- Density tiers (by total role count): ≥100 → full visuals with benchmarks; 30–99 → core charts, “limited sample”; <30 → compact summary card, no statistical claims.
- Enrichment fingerprint tiers (by enriched role count): ≥20 → Full Fingerprint; 1–19 → Partial Signal Preview (raw counts, no Lift language); 0 → Enrichment Pending.
- Comp distribution floor: ≥15 normalized-disclosed roles before a distribution chart renders.
- Synthesis-first: every page opens with a verdict, not a chart description.
- Persistent data-quality footer on every page.
Why this chart shape (not that one)
Every panel picks a form because of the question, not variety for its own sake:
| Form | Use when |
|---|---|
| 100% stacked bar / donut | Composition: “what share of the whole?” (≤6 categories for donuts) |
| Signed delta / diverging lollipop | Over/under vs a baseline, or Lift vs market |
| Ridgeline / KDE | Distribution shape (pay bands, score axes): median alone lies |
| Dumbbell | Two-point comparison (a16z median vs market median at the same seniority) |
| Bubble / scatter | Two variables at once (rate × concentration, Lift × prevalence) |
| Heatmap / treemap | Crosstab or share-of-mentions |
| Rate meter / strip | Honest 0–100% rates (disclosure, behavioral signals) |
| Table / audit | Thin n: list the rows; don’t invent a distribution |
Teaching example: polar-area for behavioral signals was built, then reverted. With high-ownership at ~94% and a long tail, angle/area encodings distort magnitude (Cleveland–McGill). Rate meters kept the shared 0–100% scale honest.
Layer 1: Overall Dashboard (Market report)
Question: what is the market doing, across all 34,560 roles at once.
Five chapters. Linear report, not a configurable BI tool.
Chapter 1: Market Pulse
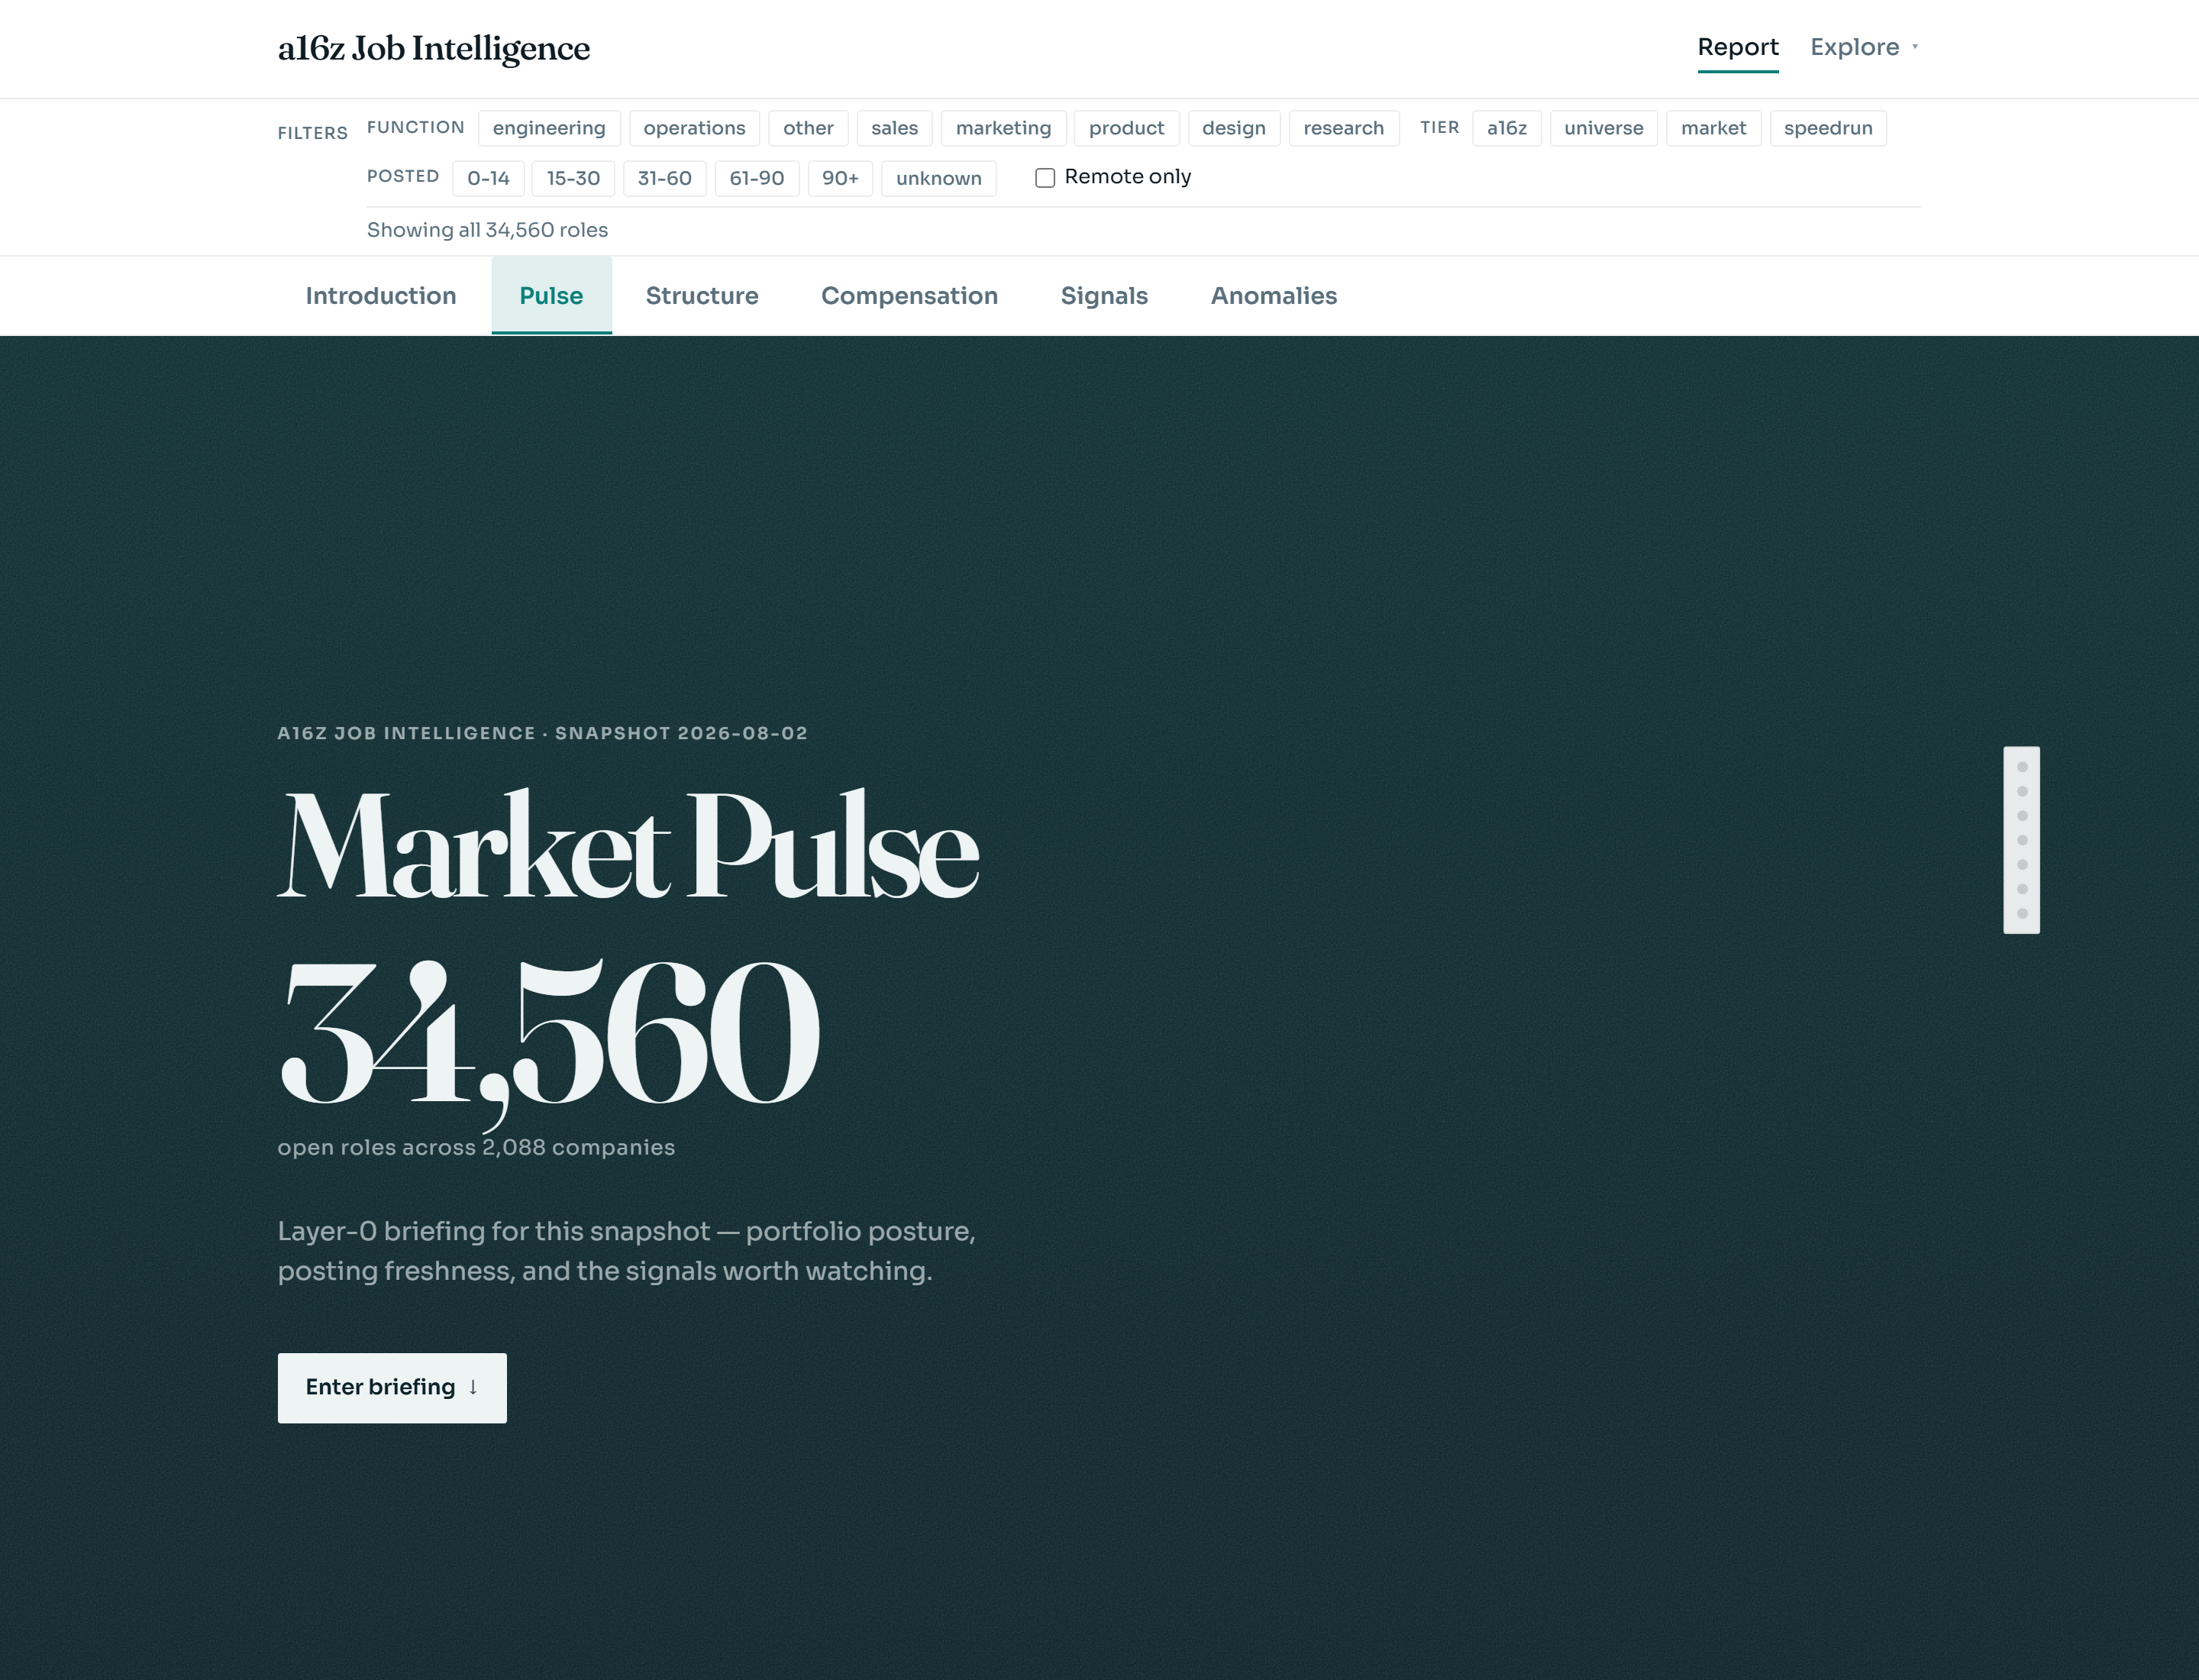
A concrete moment from the live page. The synthesis strip opens roughly like this (templated from the pack, not hardcoded):
As of 02 August 2026: the network sees ~69% of tracked roles outside its own portfolio (universe + market tiers). Posting activity skews older overall… Enrichment sits at 30,799 of 34,560 roles; the remaining 3,761 are the enrichment ceiling (no JD at source)…
Below it, one stacked bar shows portfolio-tier composition at a glance. Verdict first, evidence second.
| Widget | What it answers | Form | Why this shape |
|---|---|---|---|
| Portfolio tier composition | How roles split across a16z / universe / market / speedrun; Network Intensity ≈ share outside a16z+speedrun | 100% stacked bar | Composition question: segment width = share |
| Stealth concentration by function | Which job families are disproportionately stealth vs corpus | Signed delta bars (only when stealth n ≥ 10) | Over/under vs baseline, not raw counts |
| Posting recency by tier | How old ads are per tier: freshness vs stale inventory | Age-bucket curves / bars | Shape of age, not fake velocity |
| What this snapshot can answer | Funnel: all → enriched → disclosed → USD-normalized | Coverage funnel | Each stage is a smaller honest denominator |
| JD coverage by function | Which functions have thin analyzed-description coverage | Dot / rate meters | Comparable 0–100% rates |
| Watching this snapshot | Preview of anomalies and coverage flags | Watchlist cards → Anomalies | Triage list, not a chart |
Chapter 2: Market Structure
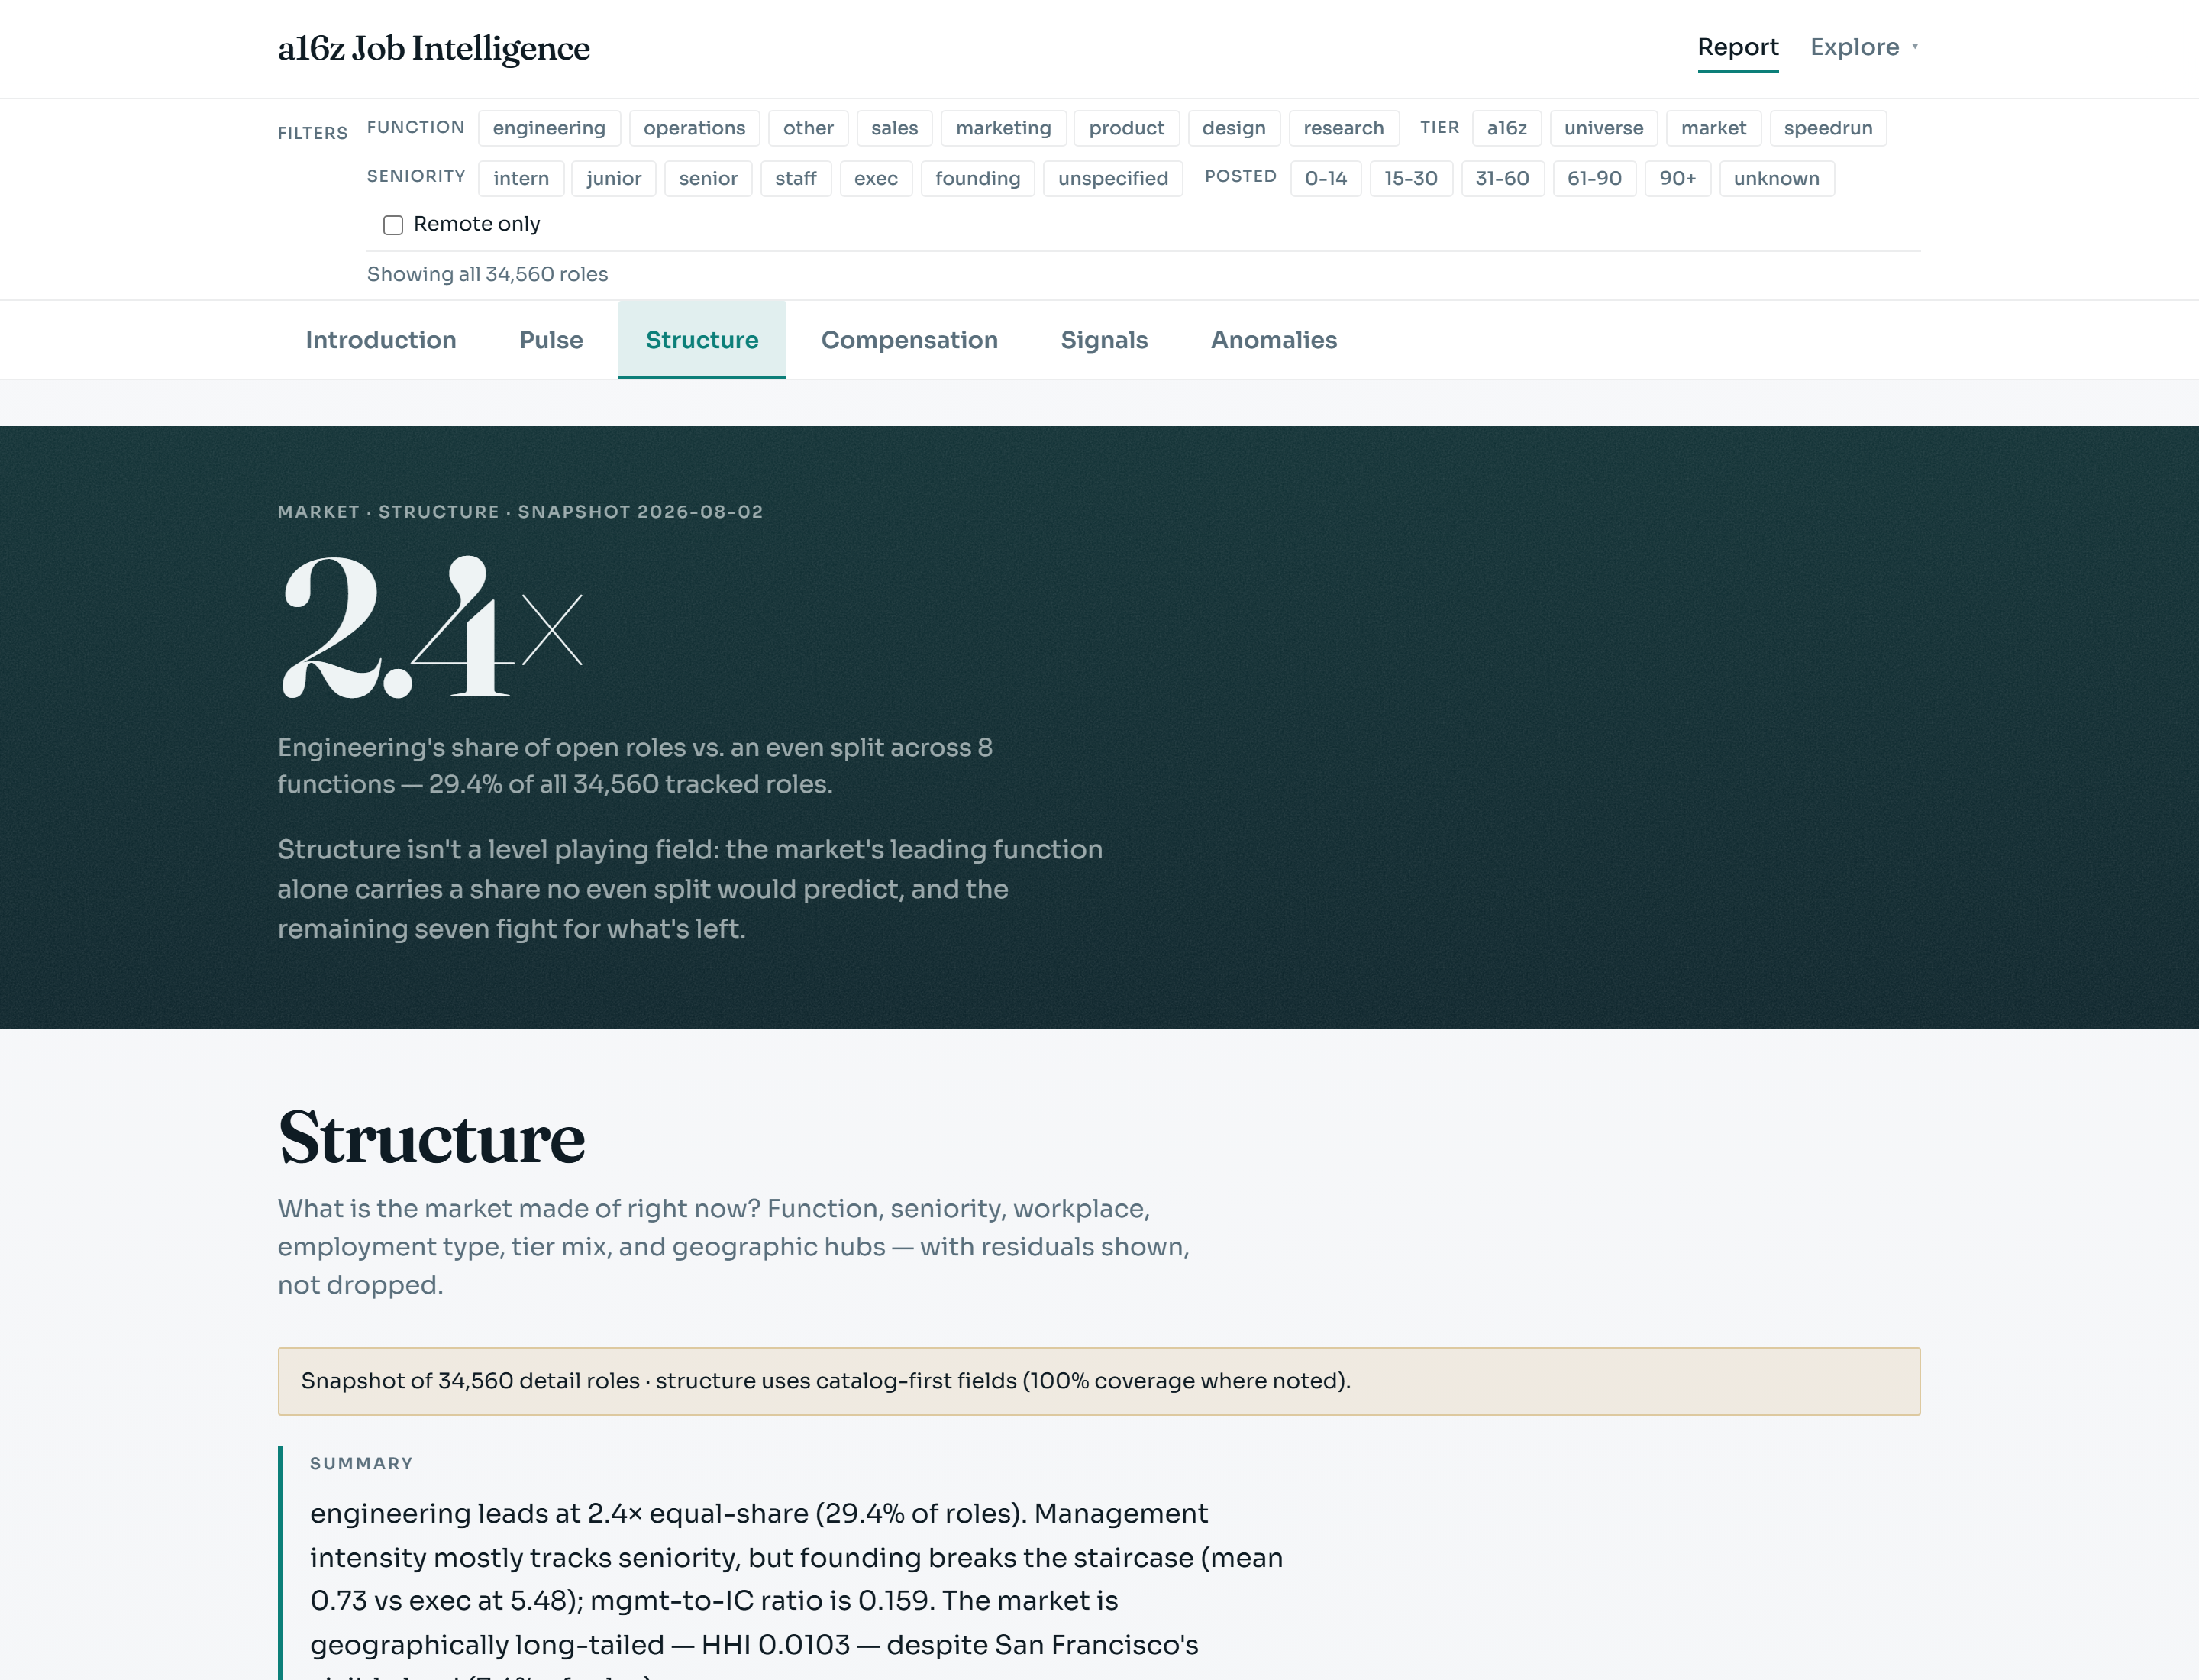
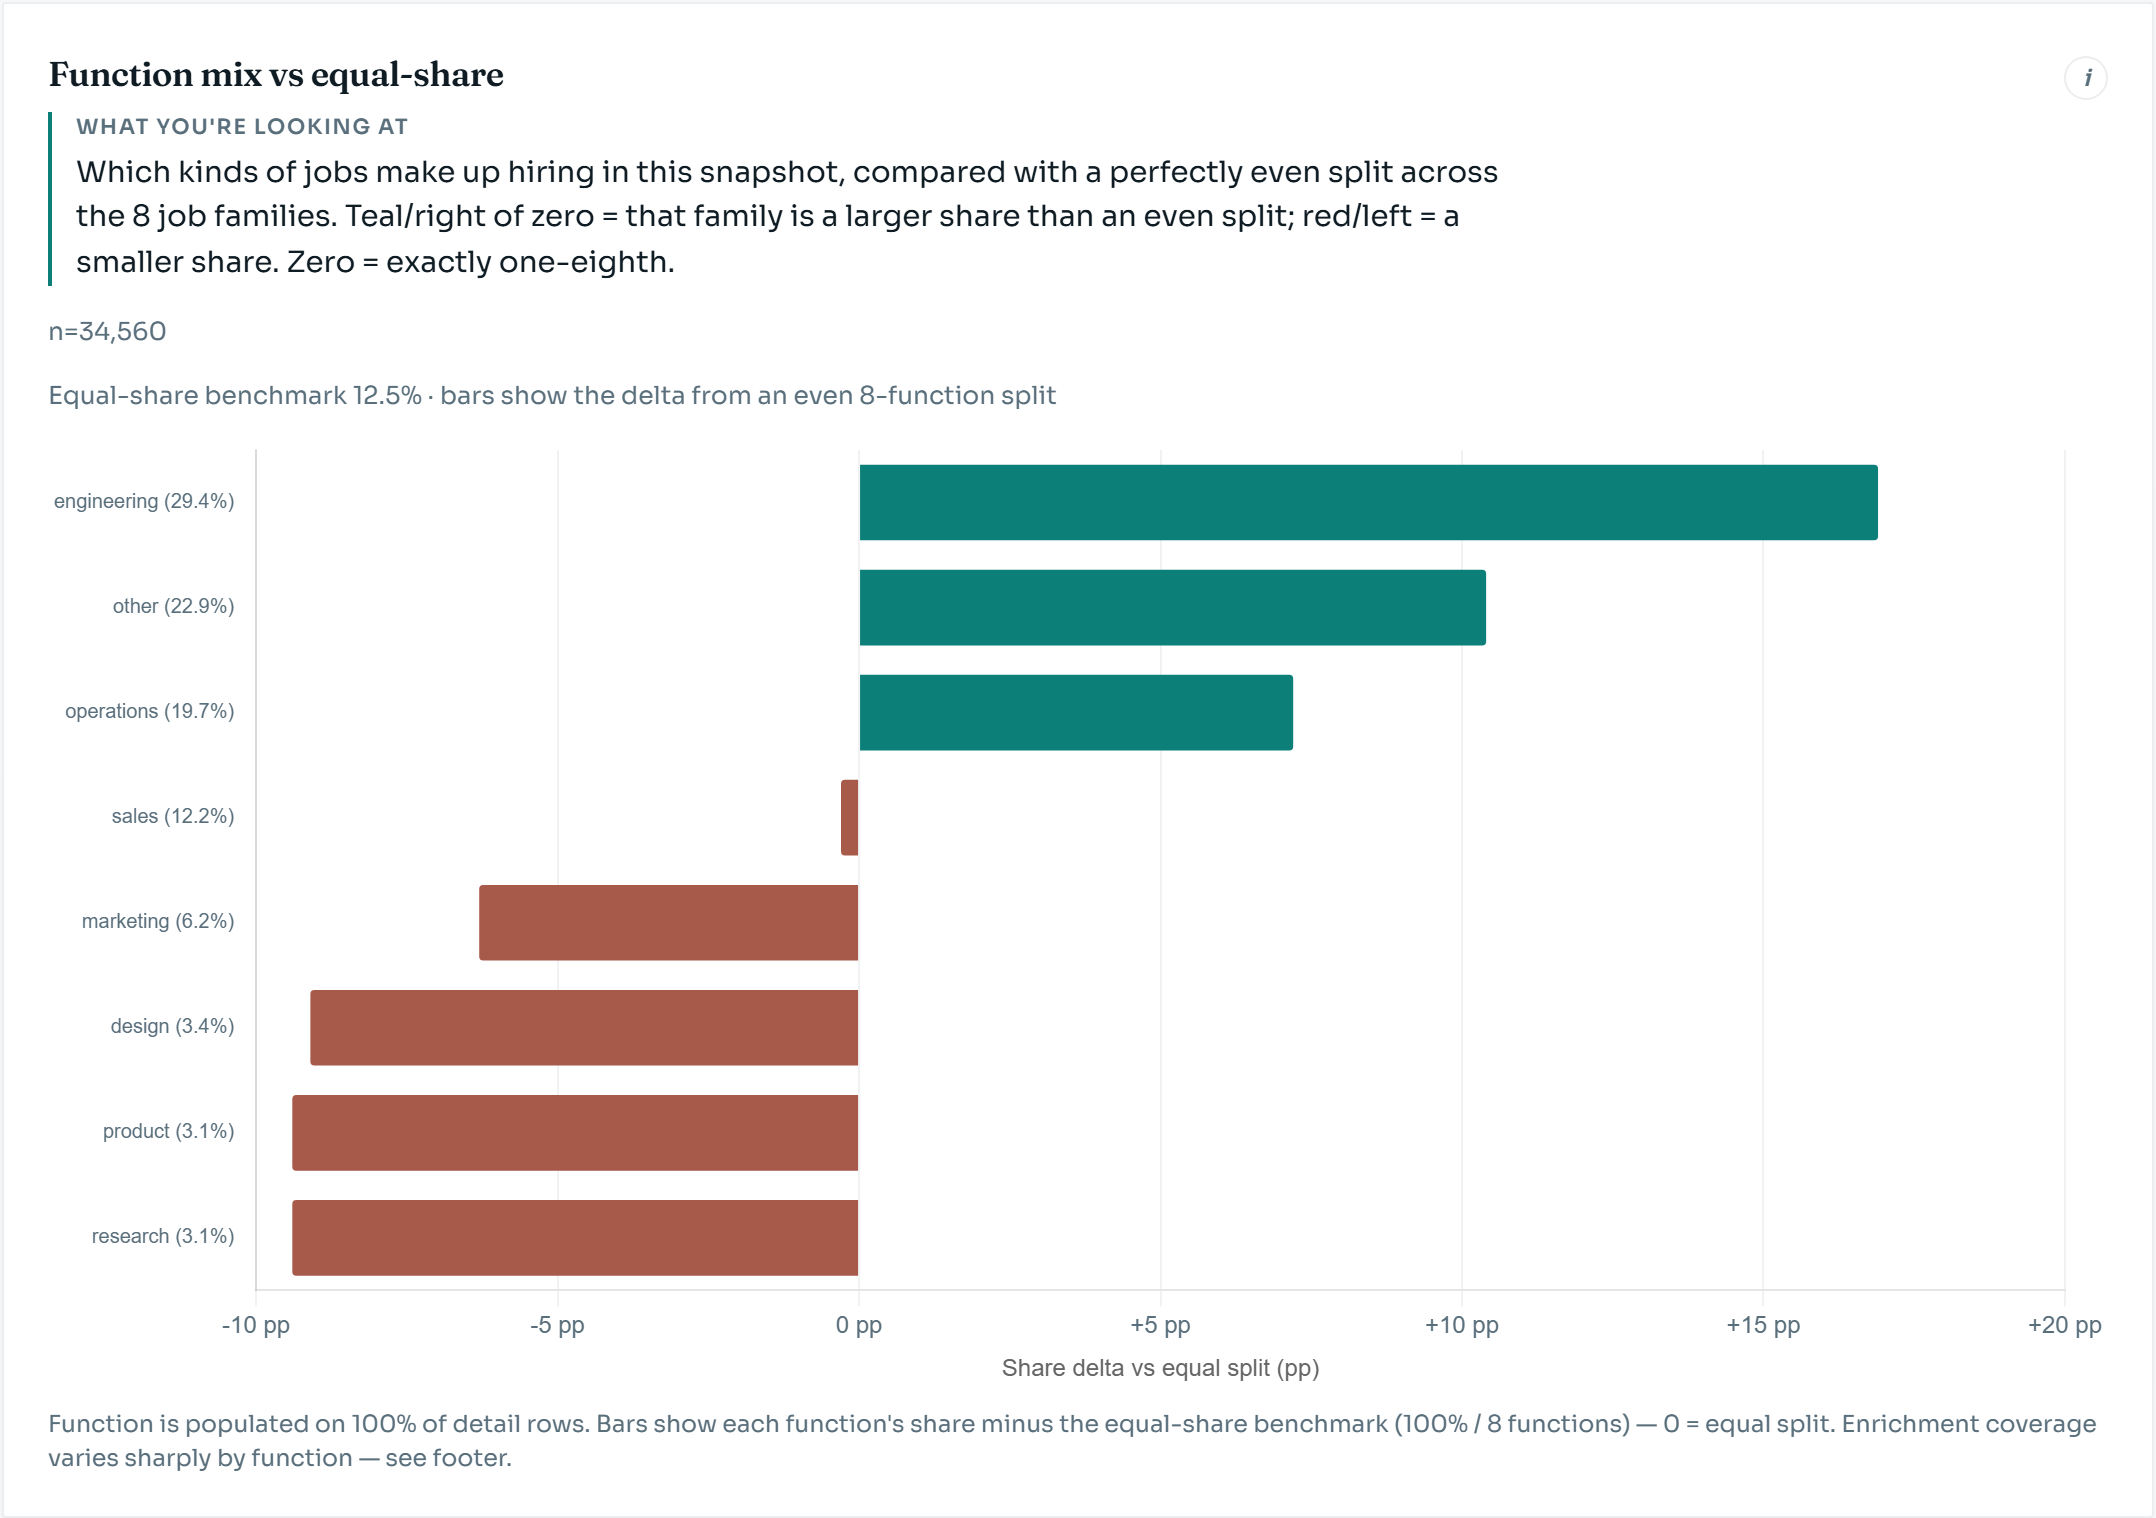
Product moment. The opening act states a signature finding: engineering alone is ~29% of open roles vs an even 12.5% eight-way split: roughly 2.4× an even share: then promotes that chart as the hero.
| Widget | What it answers | Form | Why this shape |
|---|---|---|---|
| Function mix vs equal-share | Who is over-/under-indexed vs 12.5% | Signed delta bars | Delta vs even split in one pass |
| Seniority with management intensity | Career ladder × management score | Bubble scatter | Count (size) and management load (Y) together |
| Workplace policy by function | Remote/hybrid/onsite mix per function | 100% stacked / row-normalized | Fair compare across uneven function sizes |
| Employment type | Full-time vs contract / PT / intern | Donut | Small closed set of categories |
| Portfolio tier × function | What each network circle is hiring for | Heatmap | Row-normalized crosstab |
| Geographic hubs | Where roles cluster | Treemap / mosaic + HHI | Area = volume; HHI = concentration |
Chapter 3: Compensation Intelligence
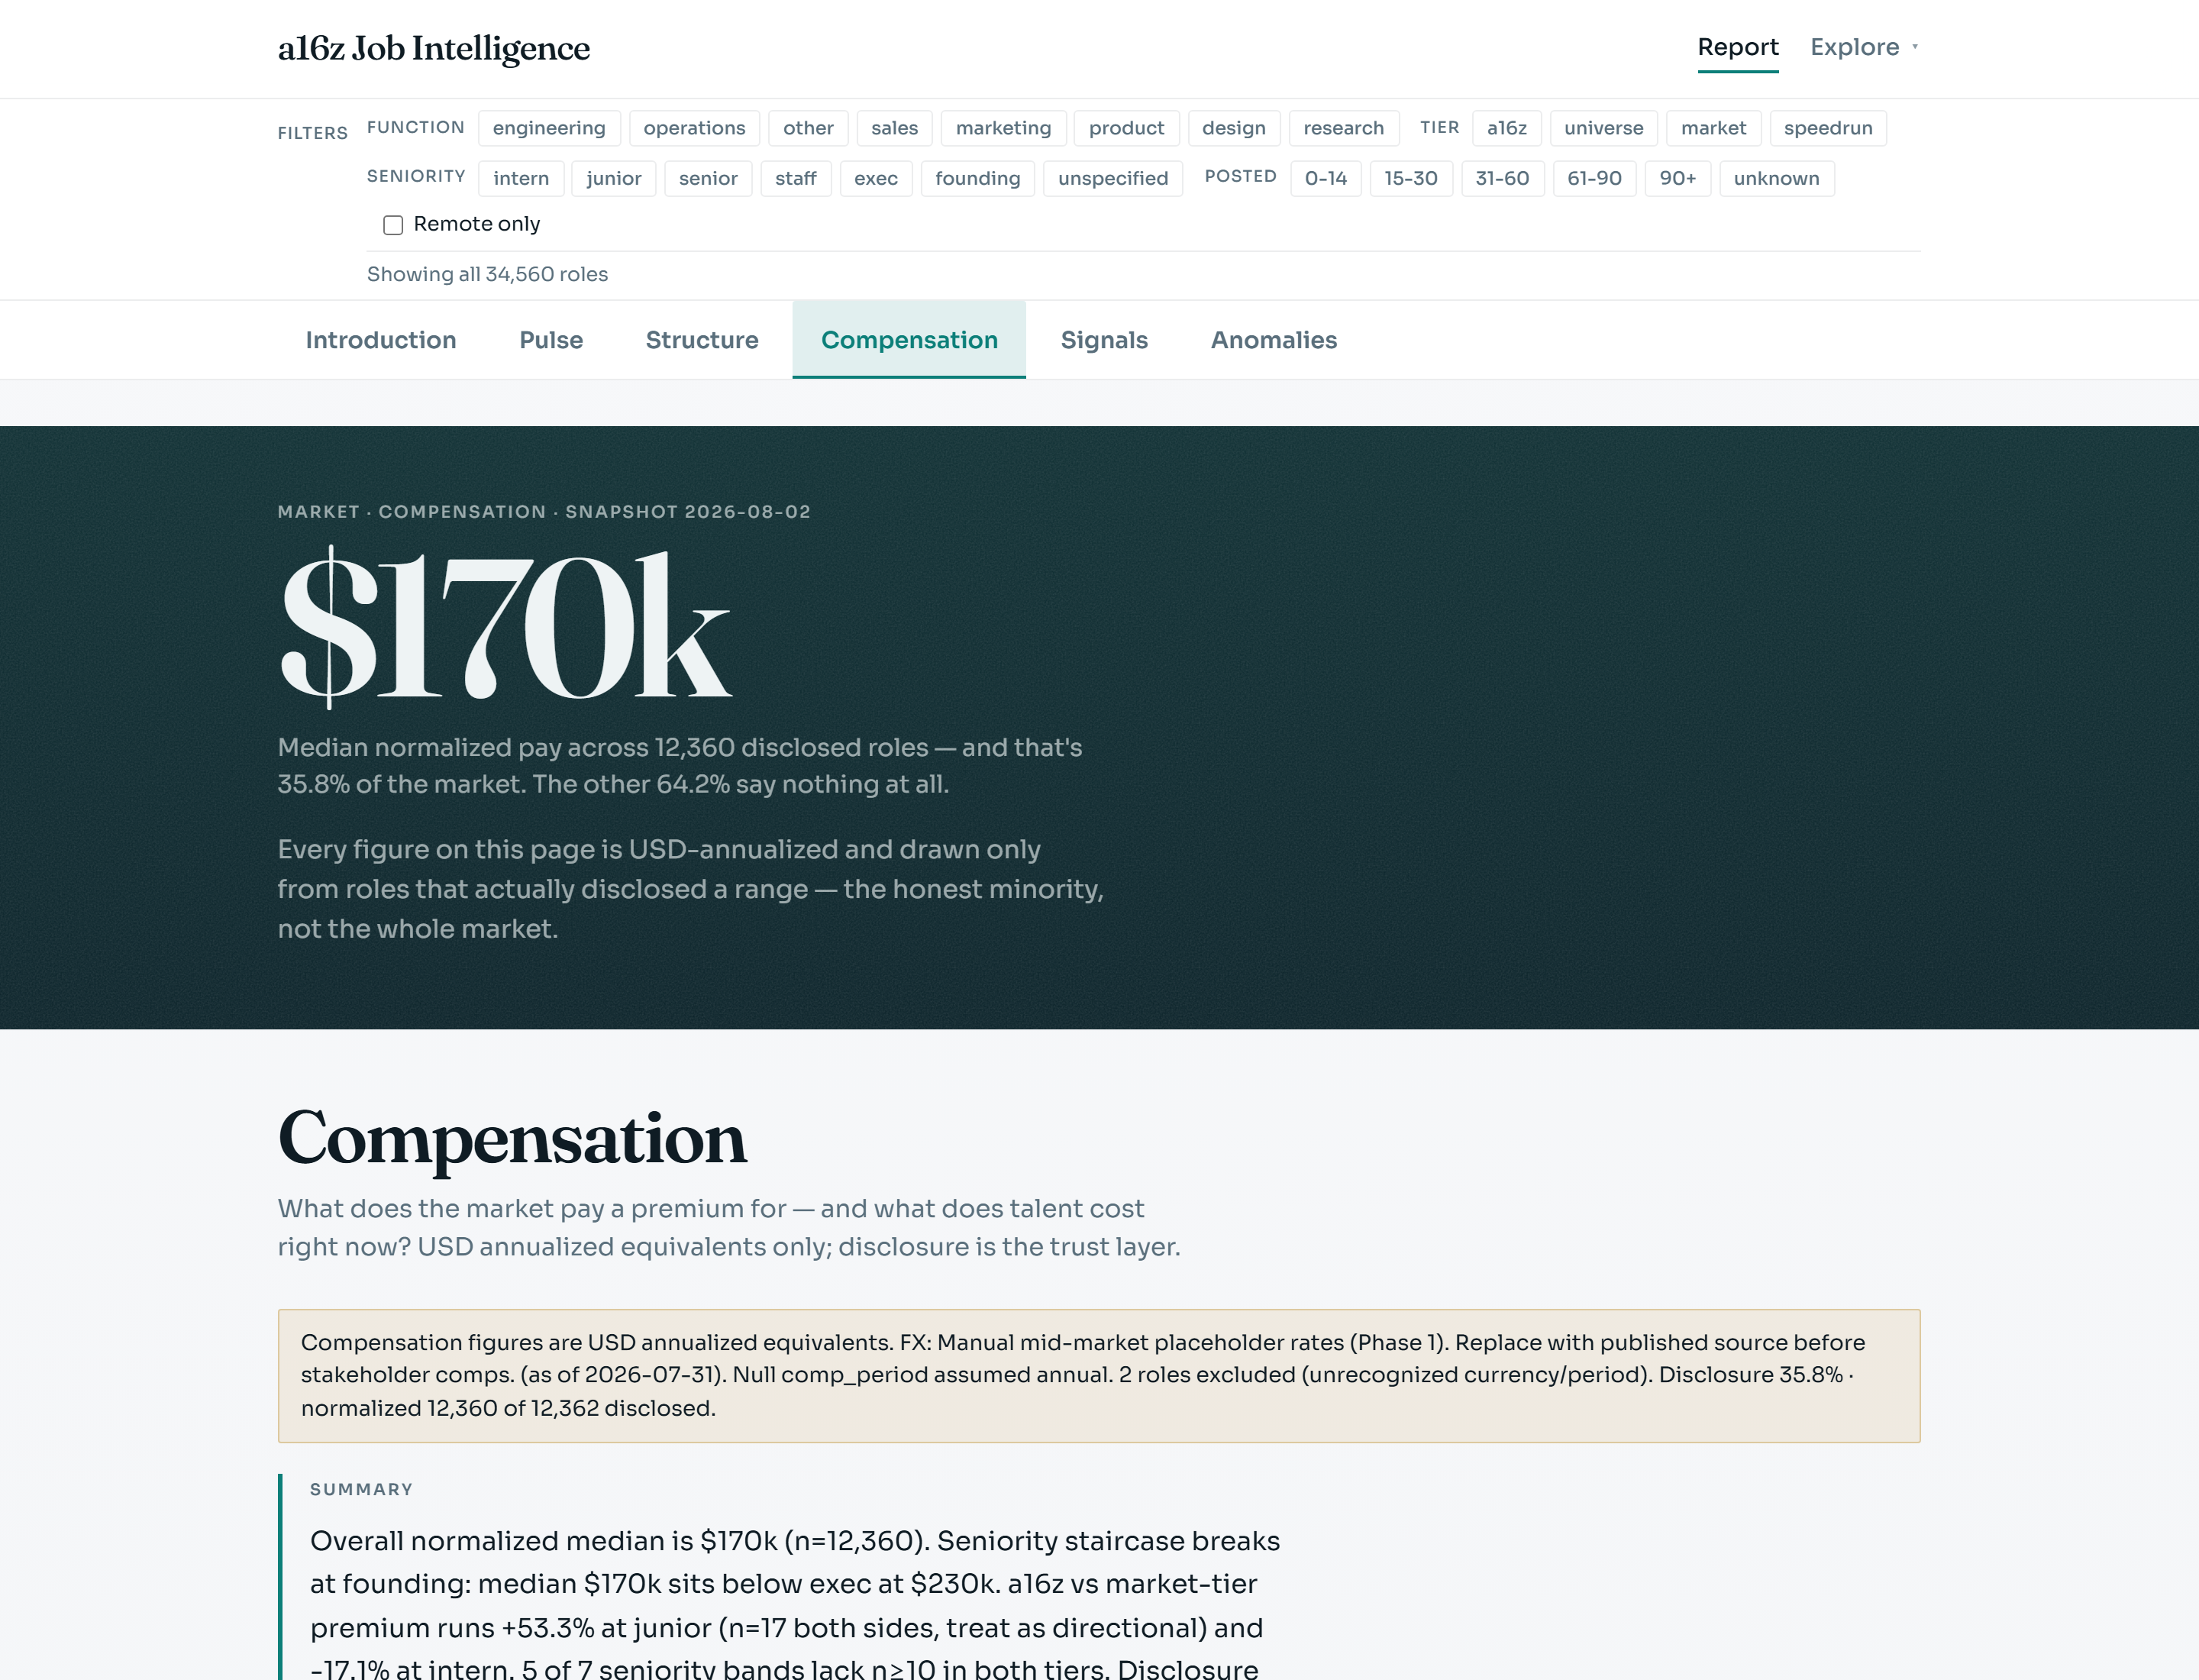
Product moment. The hero numeral is the overall normalized median: $170,000: with a label that refuses to lie:
Median normalized pay across disclosed roles: and that’s 35.8% of the market. The other 64.2% say nothing at all.
Disclosure is a market signal, not just a caveat. It varies sharply by segment. By portfolio tier (live pack): universe 45.2%, a16z 37.8%, speedrun 31.3%, market 3.4%. By function: product 46.1% down to other 27.1%. By seniority, founding roles disclose at 70.7% while some bands starve the charts. The “trust layer” chart ranks segments from most to least transparent so an executive knows immediately whether the compensation numbers represent most of the market or a thin, potentially biased slice.
| Widget | What it answers | Form | Why this shape |
|---|---|---|---|
| Compensation by seniority | Pay shape per level (USD/year) | KDE ridgelines + median dots | Shape matters more than a single average |
| a16z vs market tier premium | Do a16z employers advertise higher pay at same seniority? | Dumbbell | Two medians + gap on one row |
| Compensation by function | Pay shape per craft | Ridgelines | Same distribution question, different cut |
| What commands a premium | Archetype / hard-gate pay premiums vs overall median | Diverging lollipops | Signed % vs $170k baseline |
| Disclosure rate by segment | Trust layer: family / seniority / tier | Rate strips + overall hairline | Transparency is the finding |
| Compensation distribution | Full midpoint histogram + Tukey fence | Histogram | Where “unusual” pay starts |
Chapter 4: Market Signals
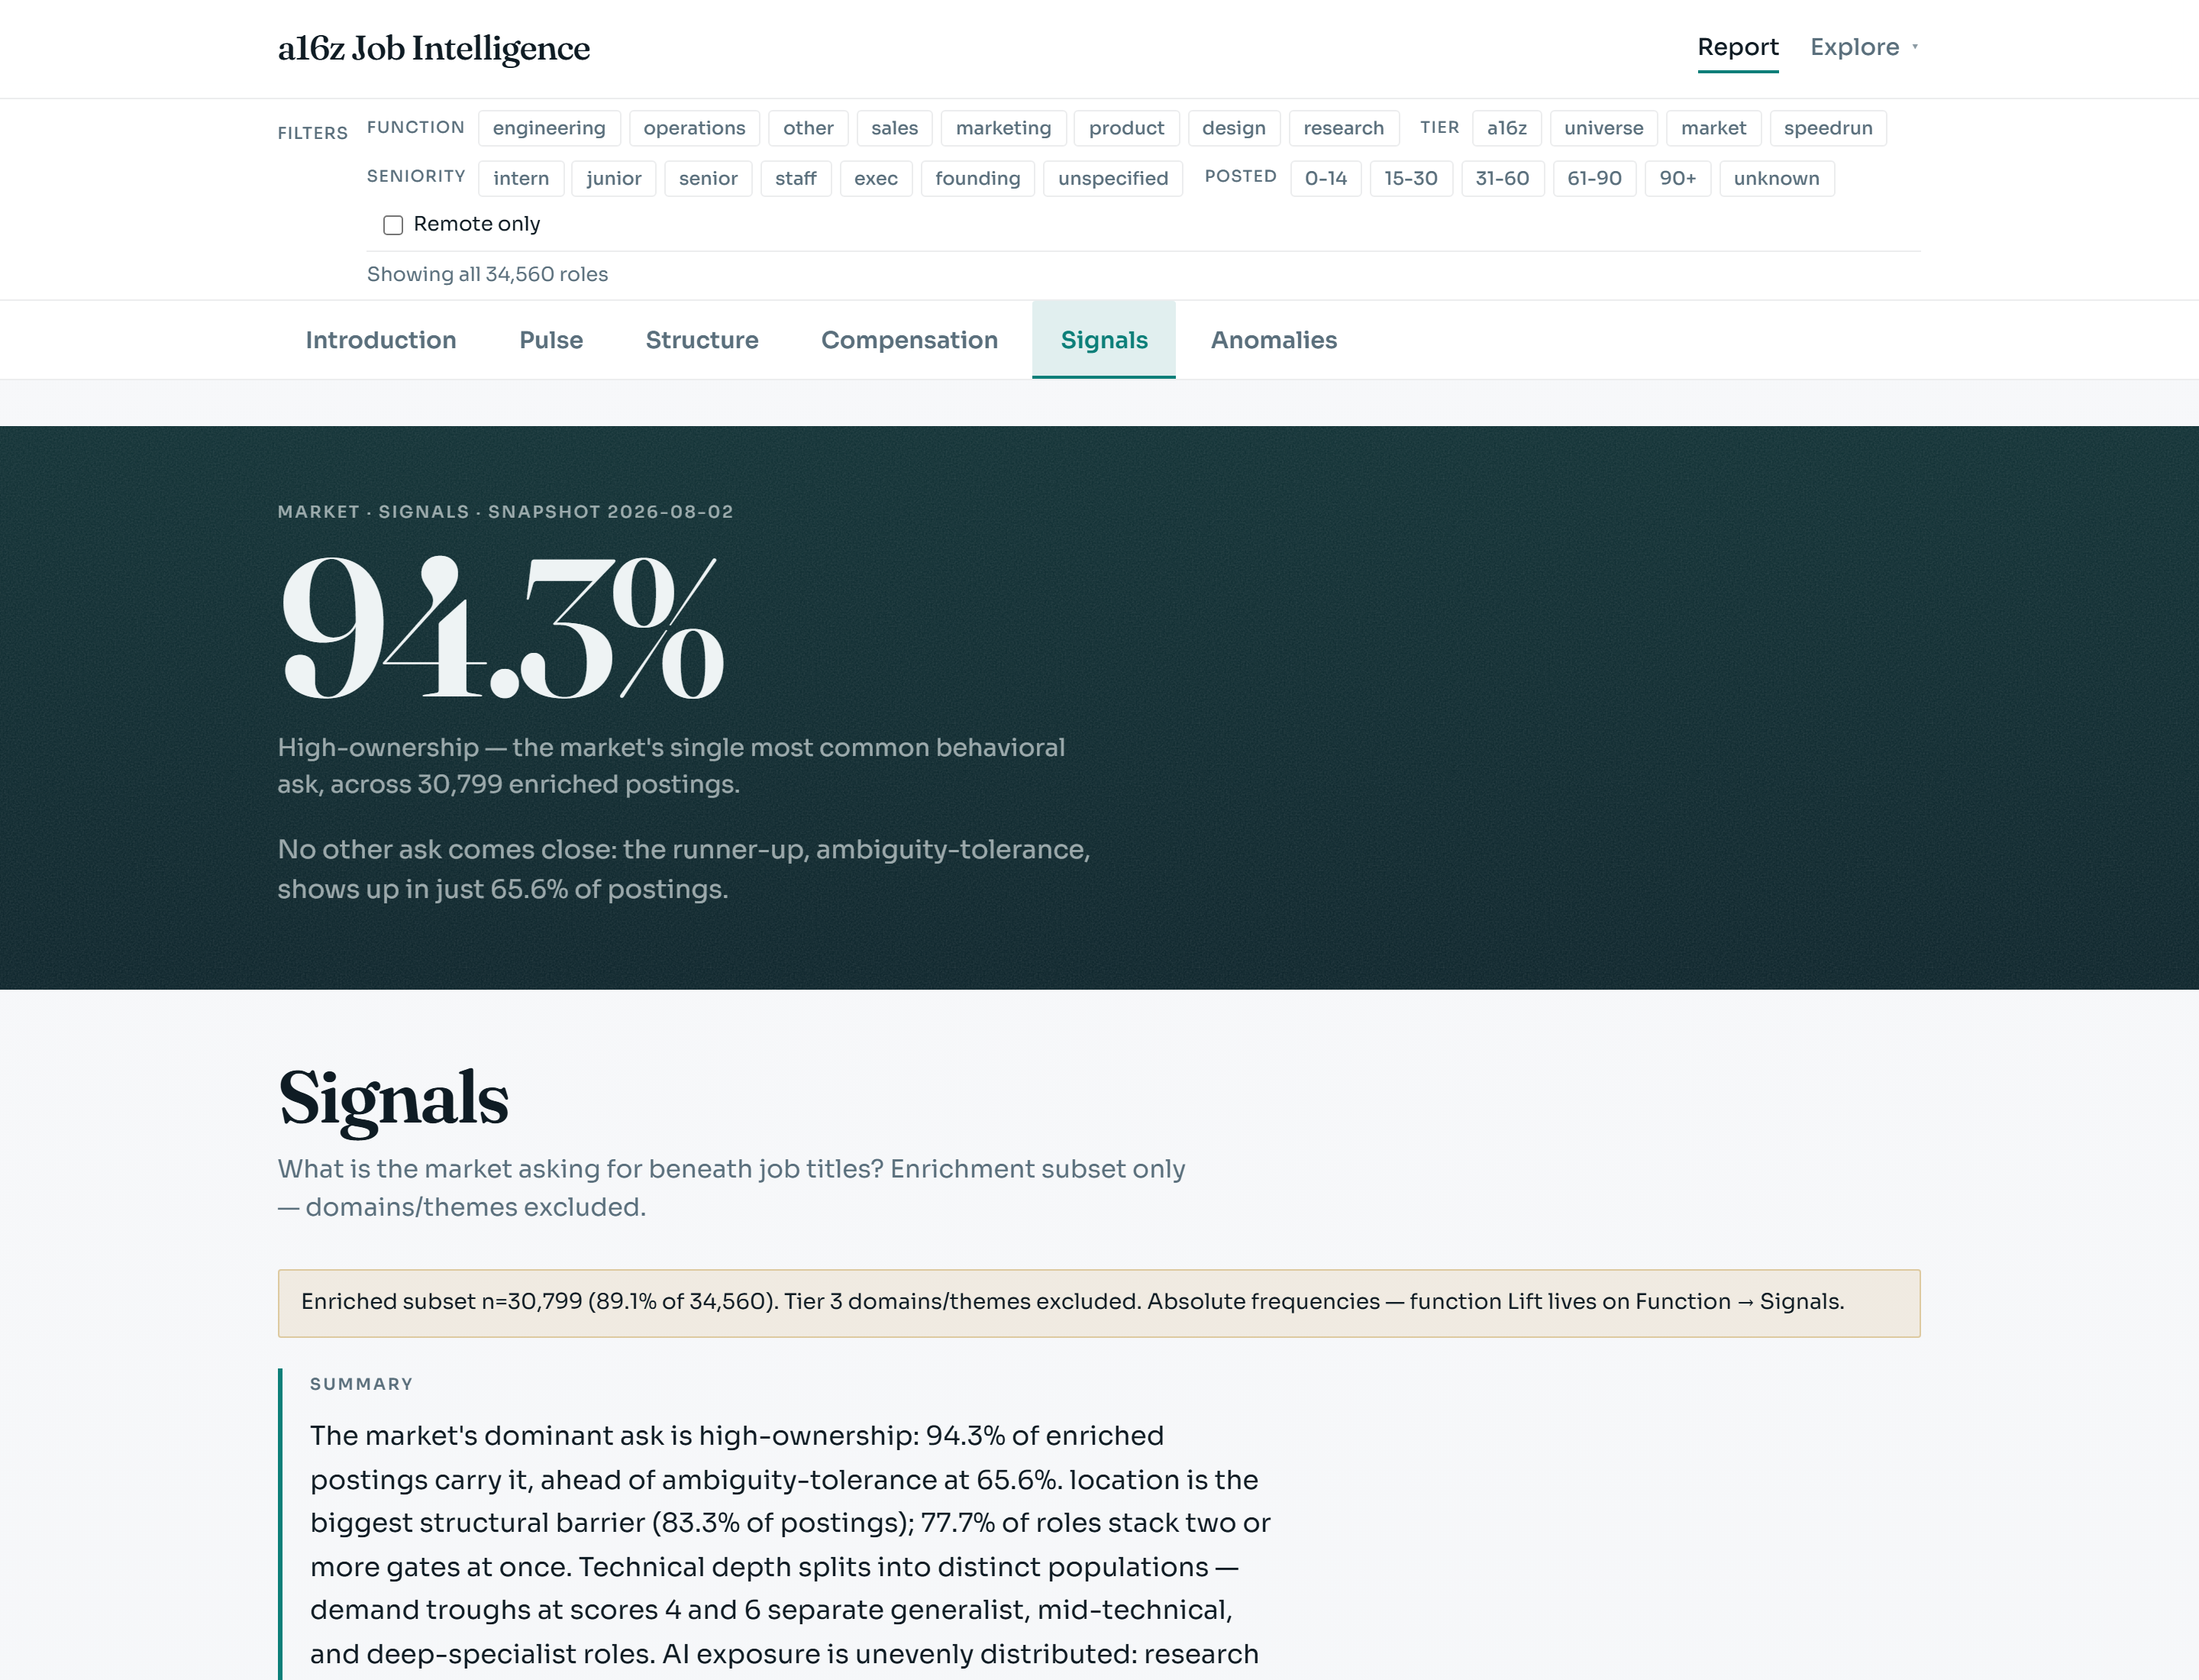
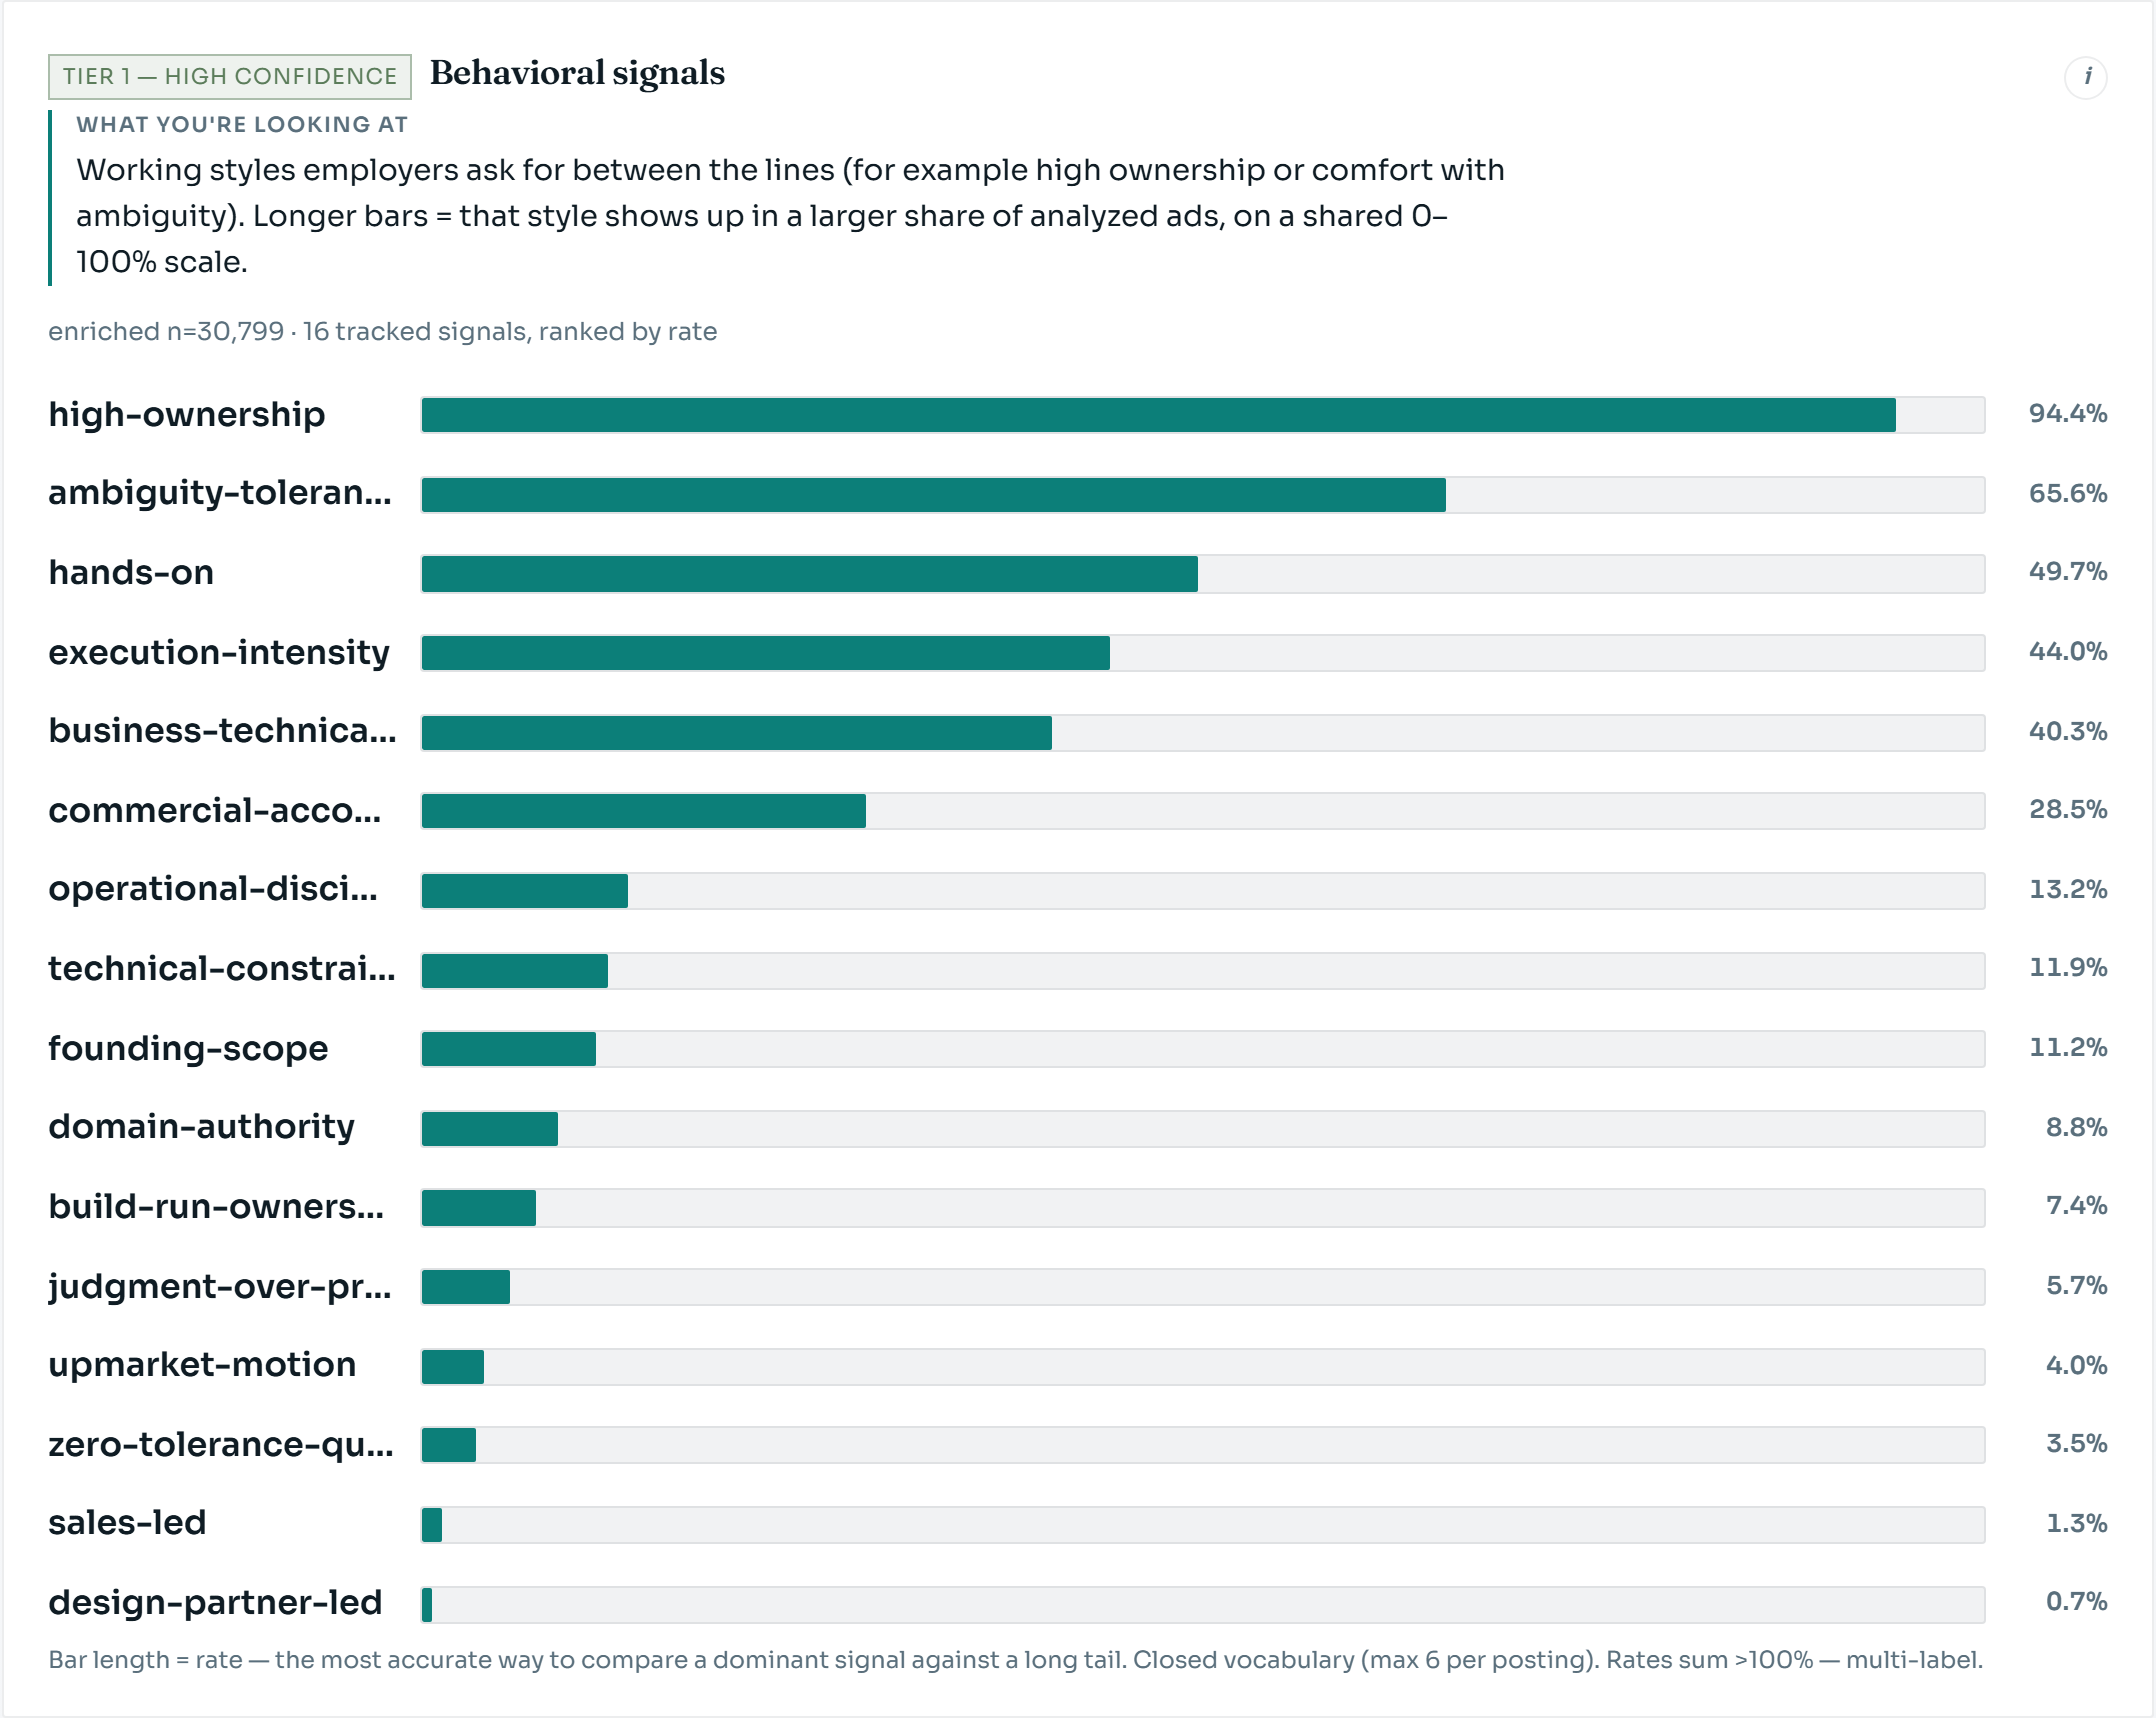
Product moment. The hero calls out the dominant behavioral signal: high-ownership at ~94% of enriched postings: the market’s single most common working-style ask: then the page refuses to chart that as a polar area (see mistakes). Rate meters keep every ask on the same 0–100% length scale:
| Widget | What it answers | Form | Why this shape |
|---|---|---|---|
| Archetypes: prevalence vs concentration | Role shapes: common vs owned by one function | Bubble scatter | Two axes: rate and concentration |
| Normalized skills | Absolute skill demand in analyzed ads | Dot plot | Ranked rates without fake 100% scale |
| Skill co-occurrence matrix | Which skills travel together | Heatmap | Pair intensity |
| Hard gates | Structural filters’ share of mentions | Treemap | Area = share of gate mentions |
| Behavioral signals | Working-style rates on a shared 0–100% scale | Rate meters | Length comparable; polar area rejected |
| Signal / outcome × function | Where mentions land by craft | Heatmap | Row sums to 100% |
| Role score profiles (0–10) | technical / commercial / management / AI spreads | Ridgelines | Full distribution, not one mean |
| AI exposure by function | Mean AI score vs overall tick | Dot meters | Simple level vs market tick |
| Signal density / gate load | How many tags or gates per ad | Histogram / share bar | Count of constraints, not “quality” |
Chapter 5: Anomalies & Watchlist
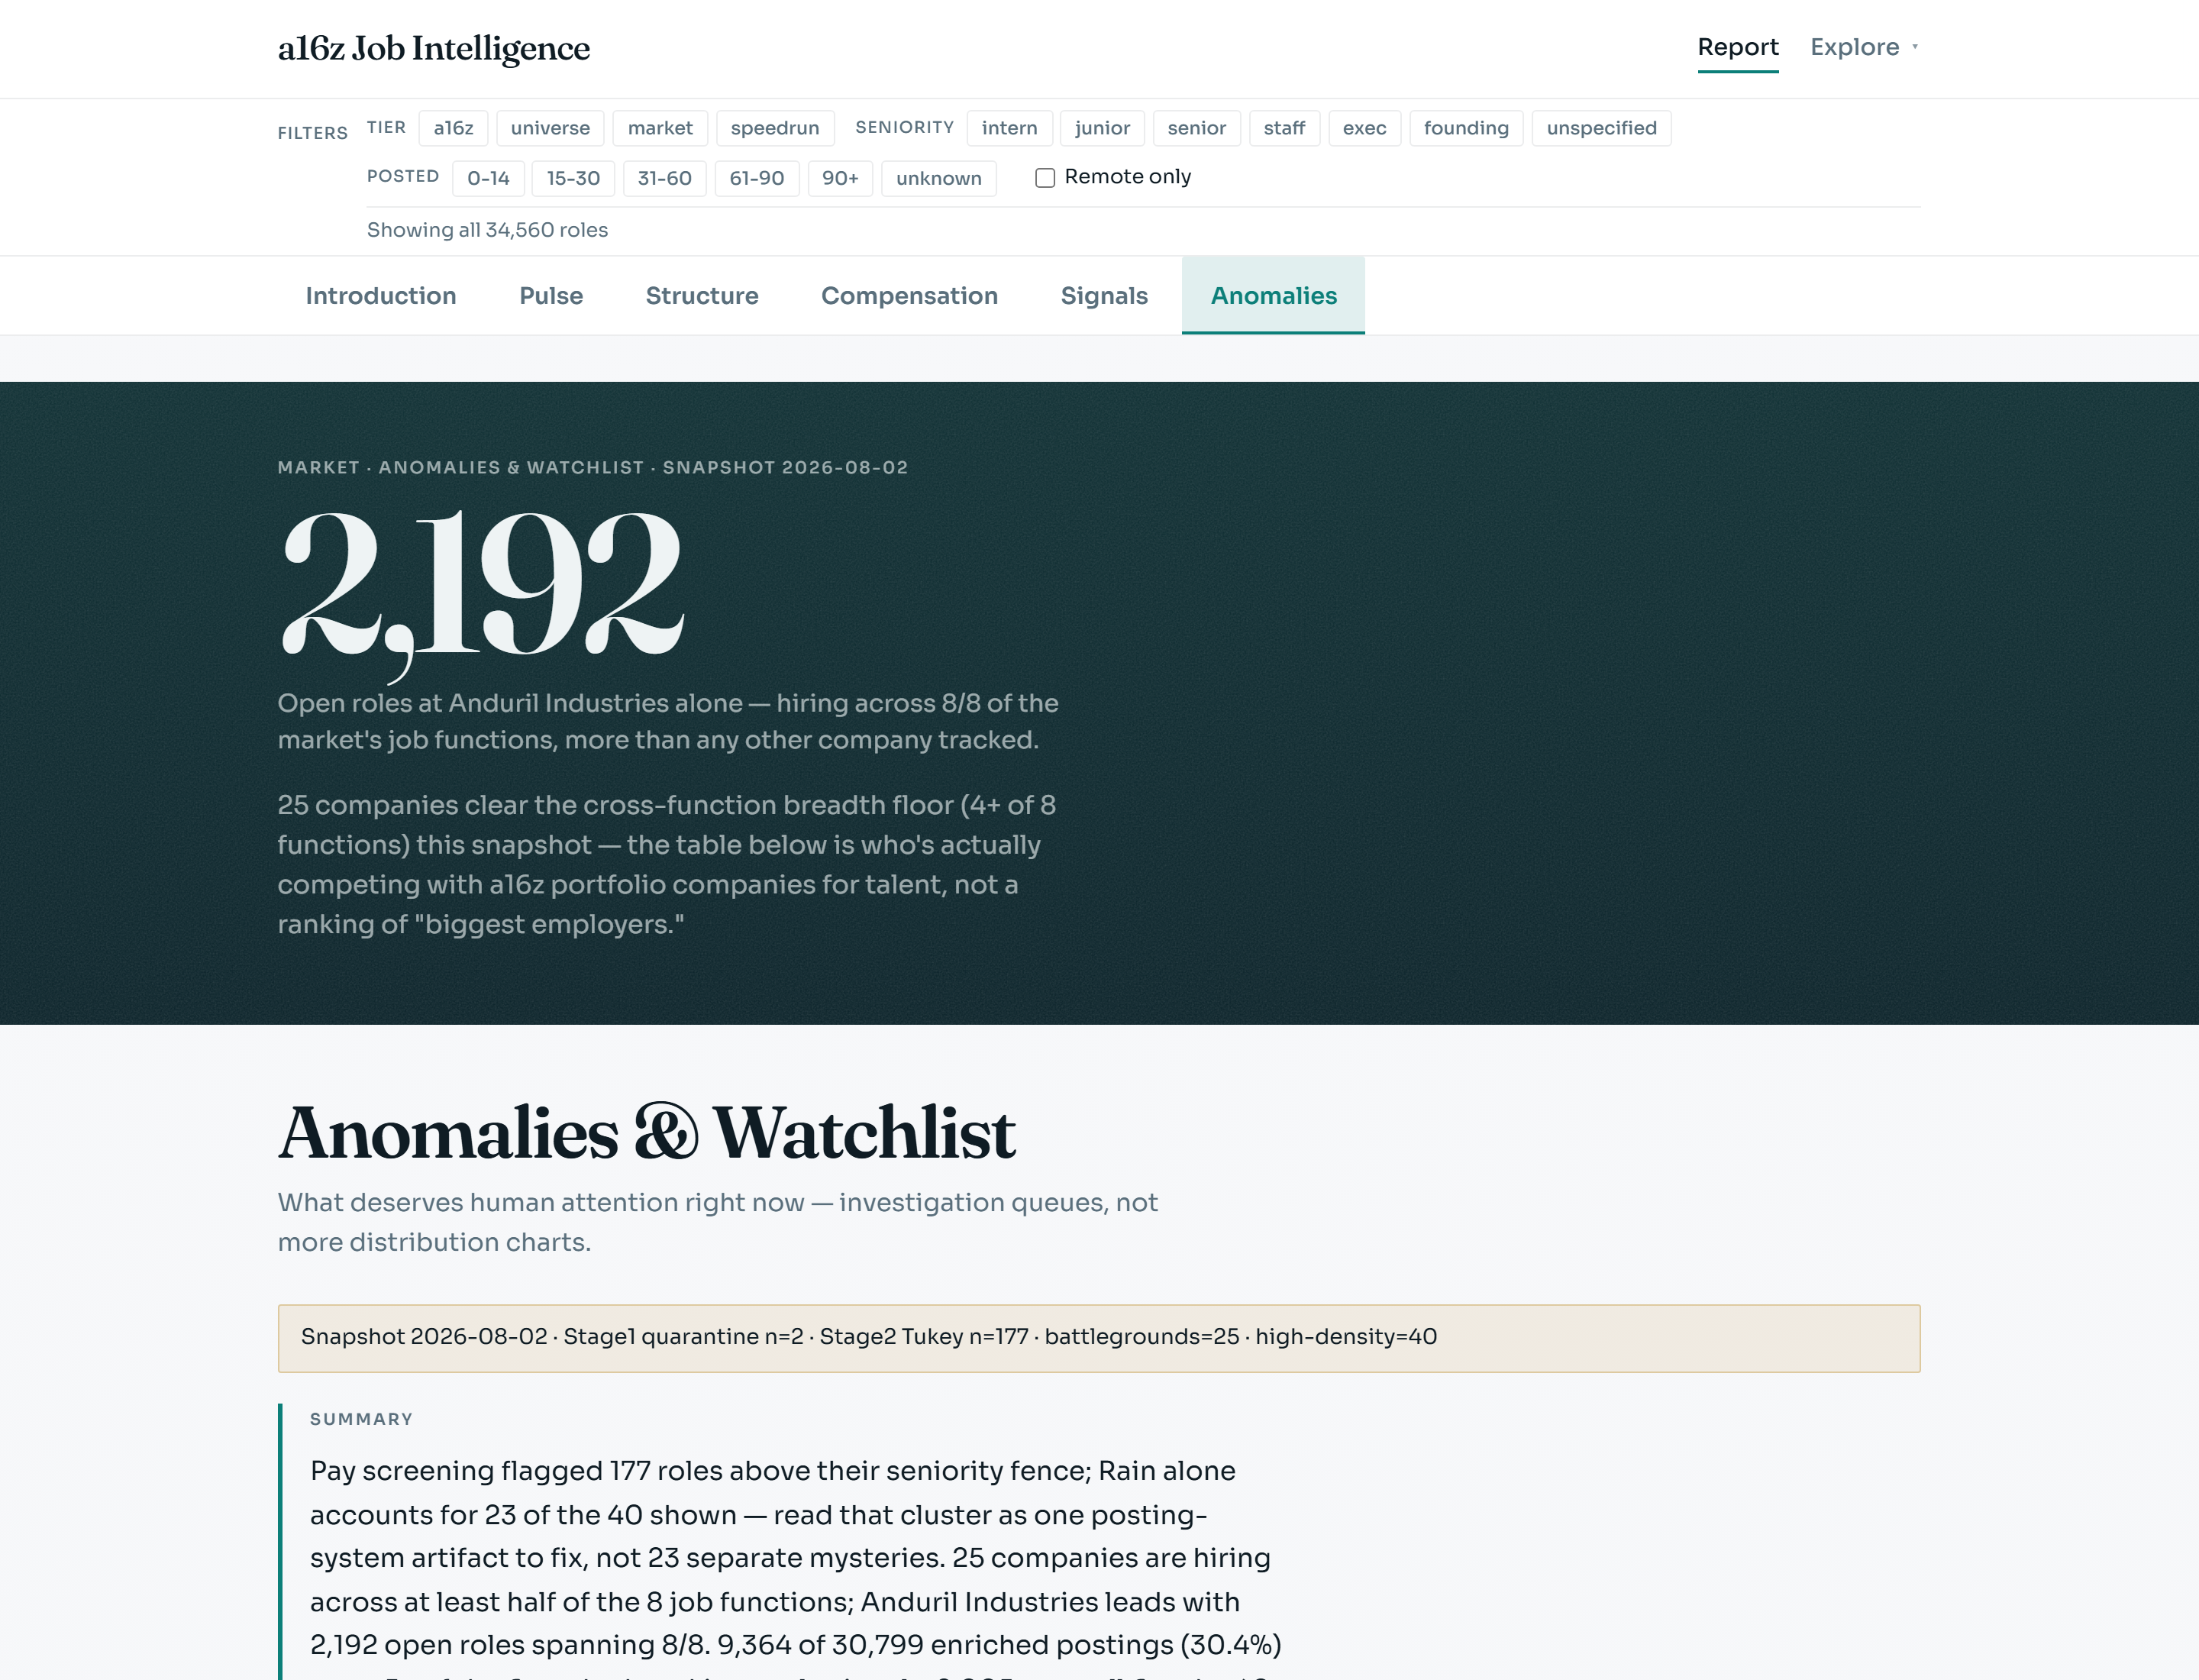
Product moment. The battlegrounds hero currently surfaces Anduril Industries: 2,192 open roles across 8/8 functions: more cross-functional hiring breadth than any other tracked employer.
| Widget | What it answers | Form |
|---|---|---|
| Compensation outliers | Pay past the statistical fence; conversion failures | Investigation tables |
| Battleground companies | Employers hiring across many functions at once | Ranked breadth list → Company pages |
| High signal-density postings | Ads stacking 5+ behavioral tags | Metered list |
| Coverage gaps & residuals | Enrichment ceilings, unspecified residuals, conversion issues | Severity-tagged alerts |
Layer 2: Function Intelligence
Question: what is this one craft doing, always benchmarked against Layer 1.
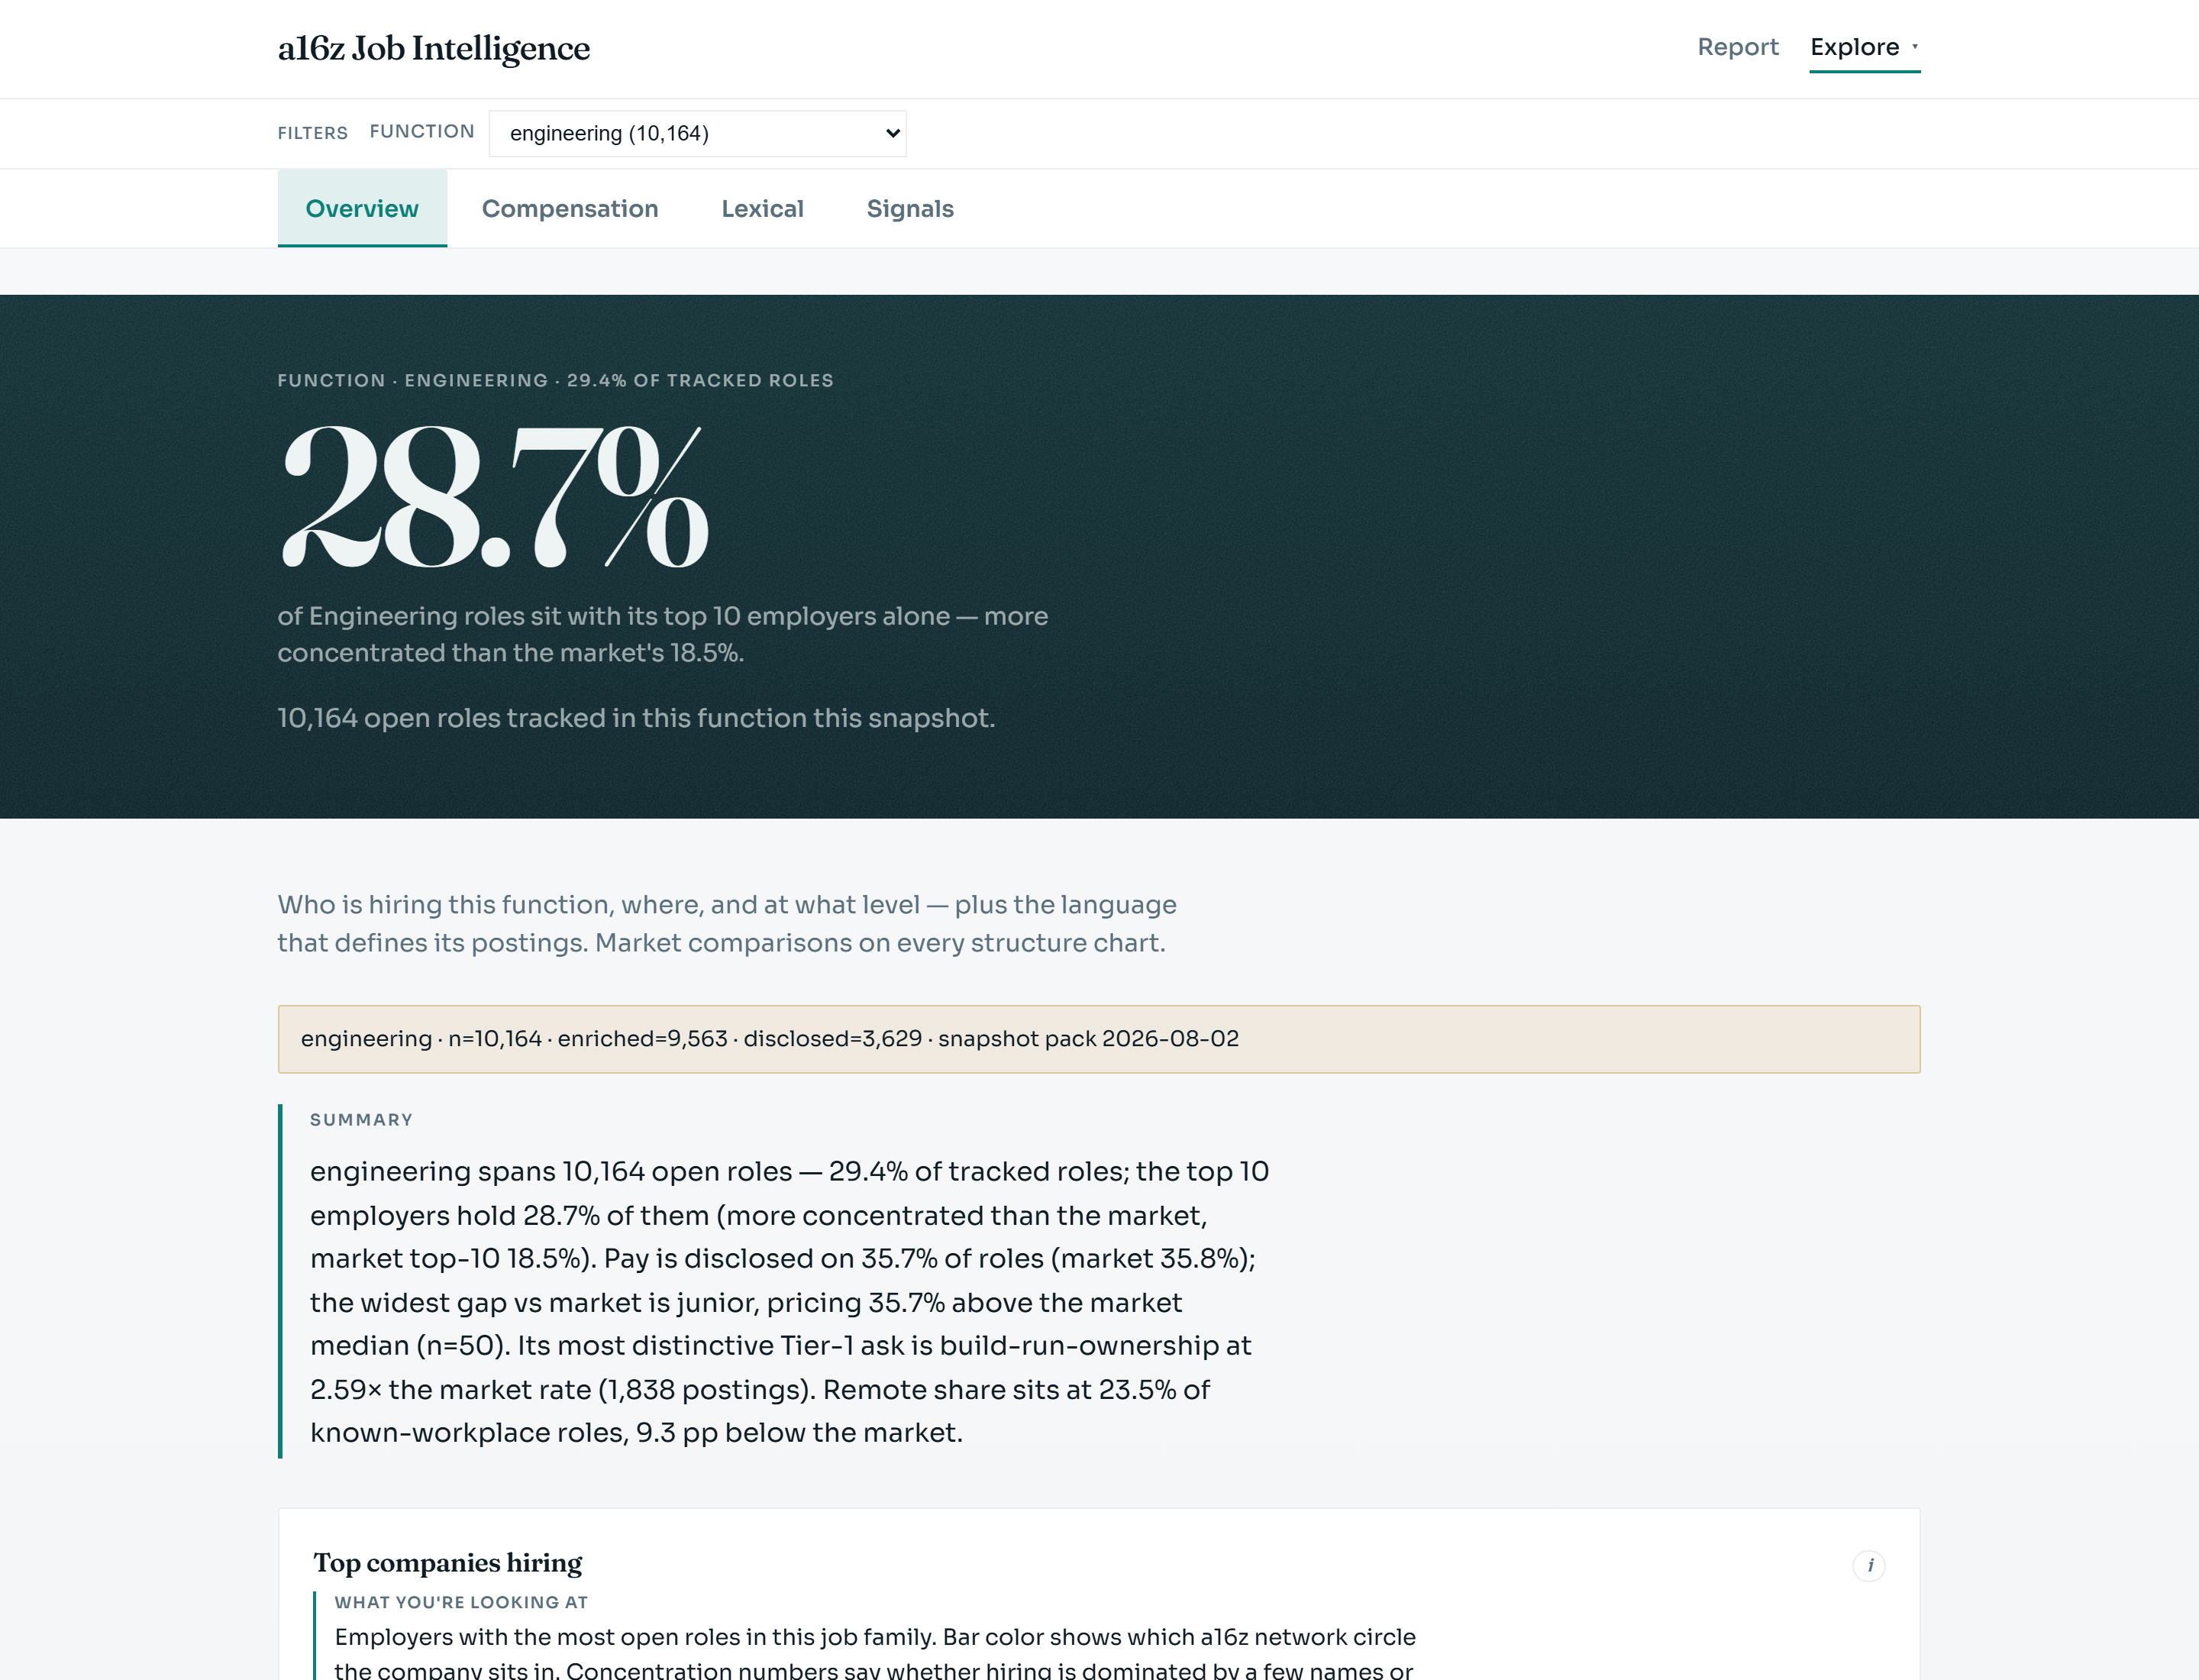
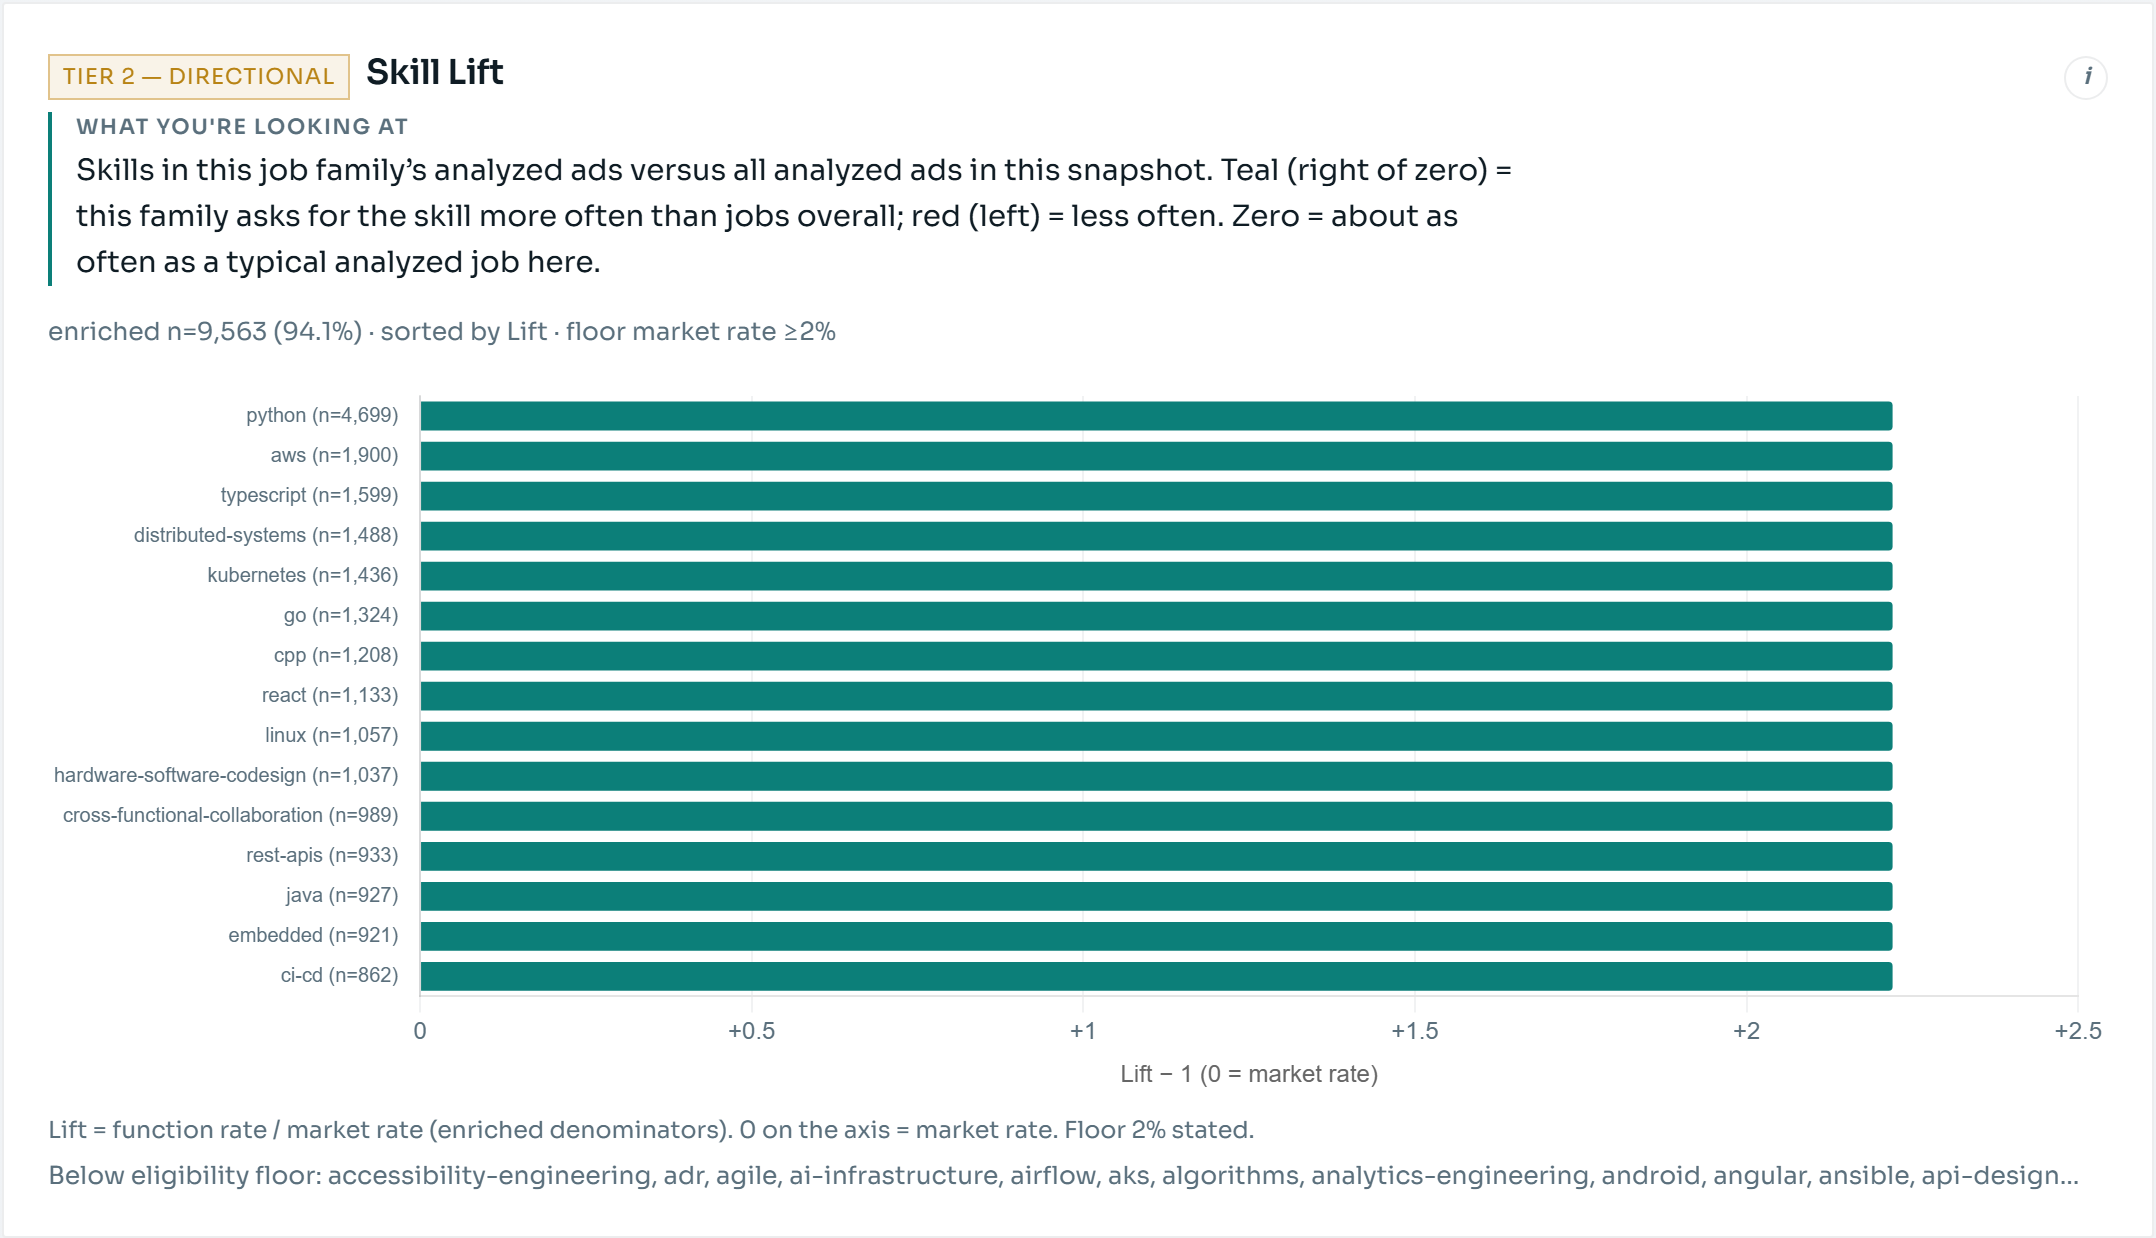
Four tabs, identical template for all eight functions. Catalog tabs always render; Signals degrades to Enrichment Pending when coverage is zero. The teaching chart on Signals is Lift: function rate ÷ market rate, floored so rare tags don’t invent “distinctiveness”:
Tab: Overview & Structure
| Widget | Question |
|---|---|
| Top companies hiring | Who dominates demand in this craft? |
| Top locations & remote | Where, and how remote vs market? |
| Seniority vs market | IC-heavy or exec-heavy vs corpus? |
| Workplace mix vs market | Signed deltas for remote/hybrid/onsite |
| Portfolio tier vs market | Which network circles over-index here? |
| Remote penetration vs market | Single bullet: function remote % vs overall |
Tab: Compensation
| Widget | Question |
|---|---|
| Comp by seniority: function vs market | Pay curves with market medians in labels |
| Function premium vs market | % gap at each seniority band |
| Disclosure by seniority | Trust layer for this craft |
| Function comp distribution | Histogram + fence |
Tab: Lexical Fingerprint
| Widget | Question |
|---|---|
| Top title unigrams | How employers name these roles |
| Top title bigrams | Two-word title phrases |
| JD term lift vs market | Words distinctive to this craft (not common everywhere) |
| Top JD bigrams | Recurring description language |
Tab: Market Signals (enrichment)
| Widget | Question |
|---|---|
| Archetype / Skill / Hard-gate / Signal / Outcome Lift | What is over-/under-indexed vs market |
| Skill pair Lift | Bundles distinctive to this craft |
| Score profiles: function vs market | Paired 0–10 ridgelines |
Layer 3: Company Intelligence
Question: how does this one employer hire.
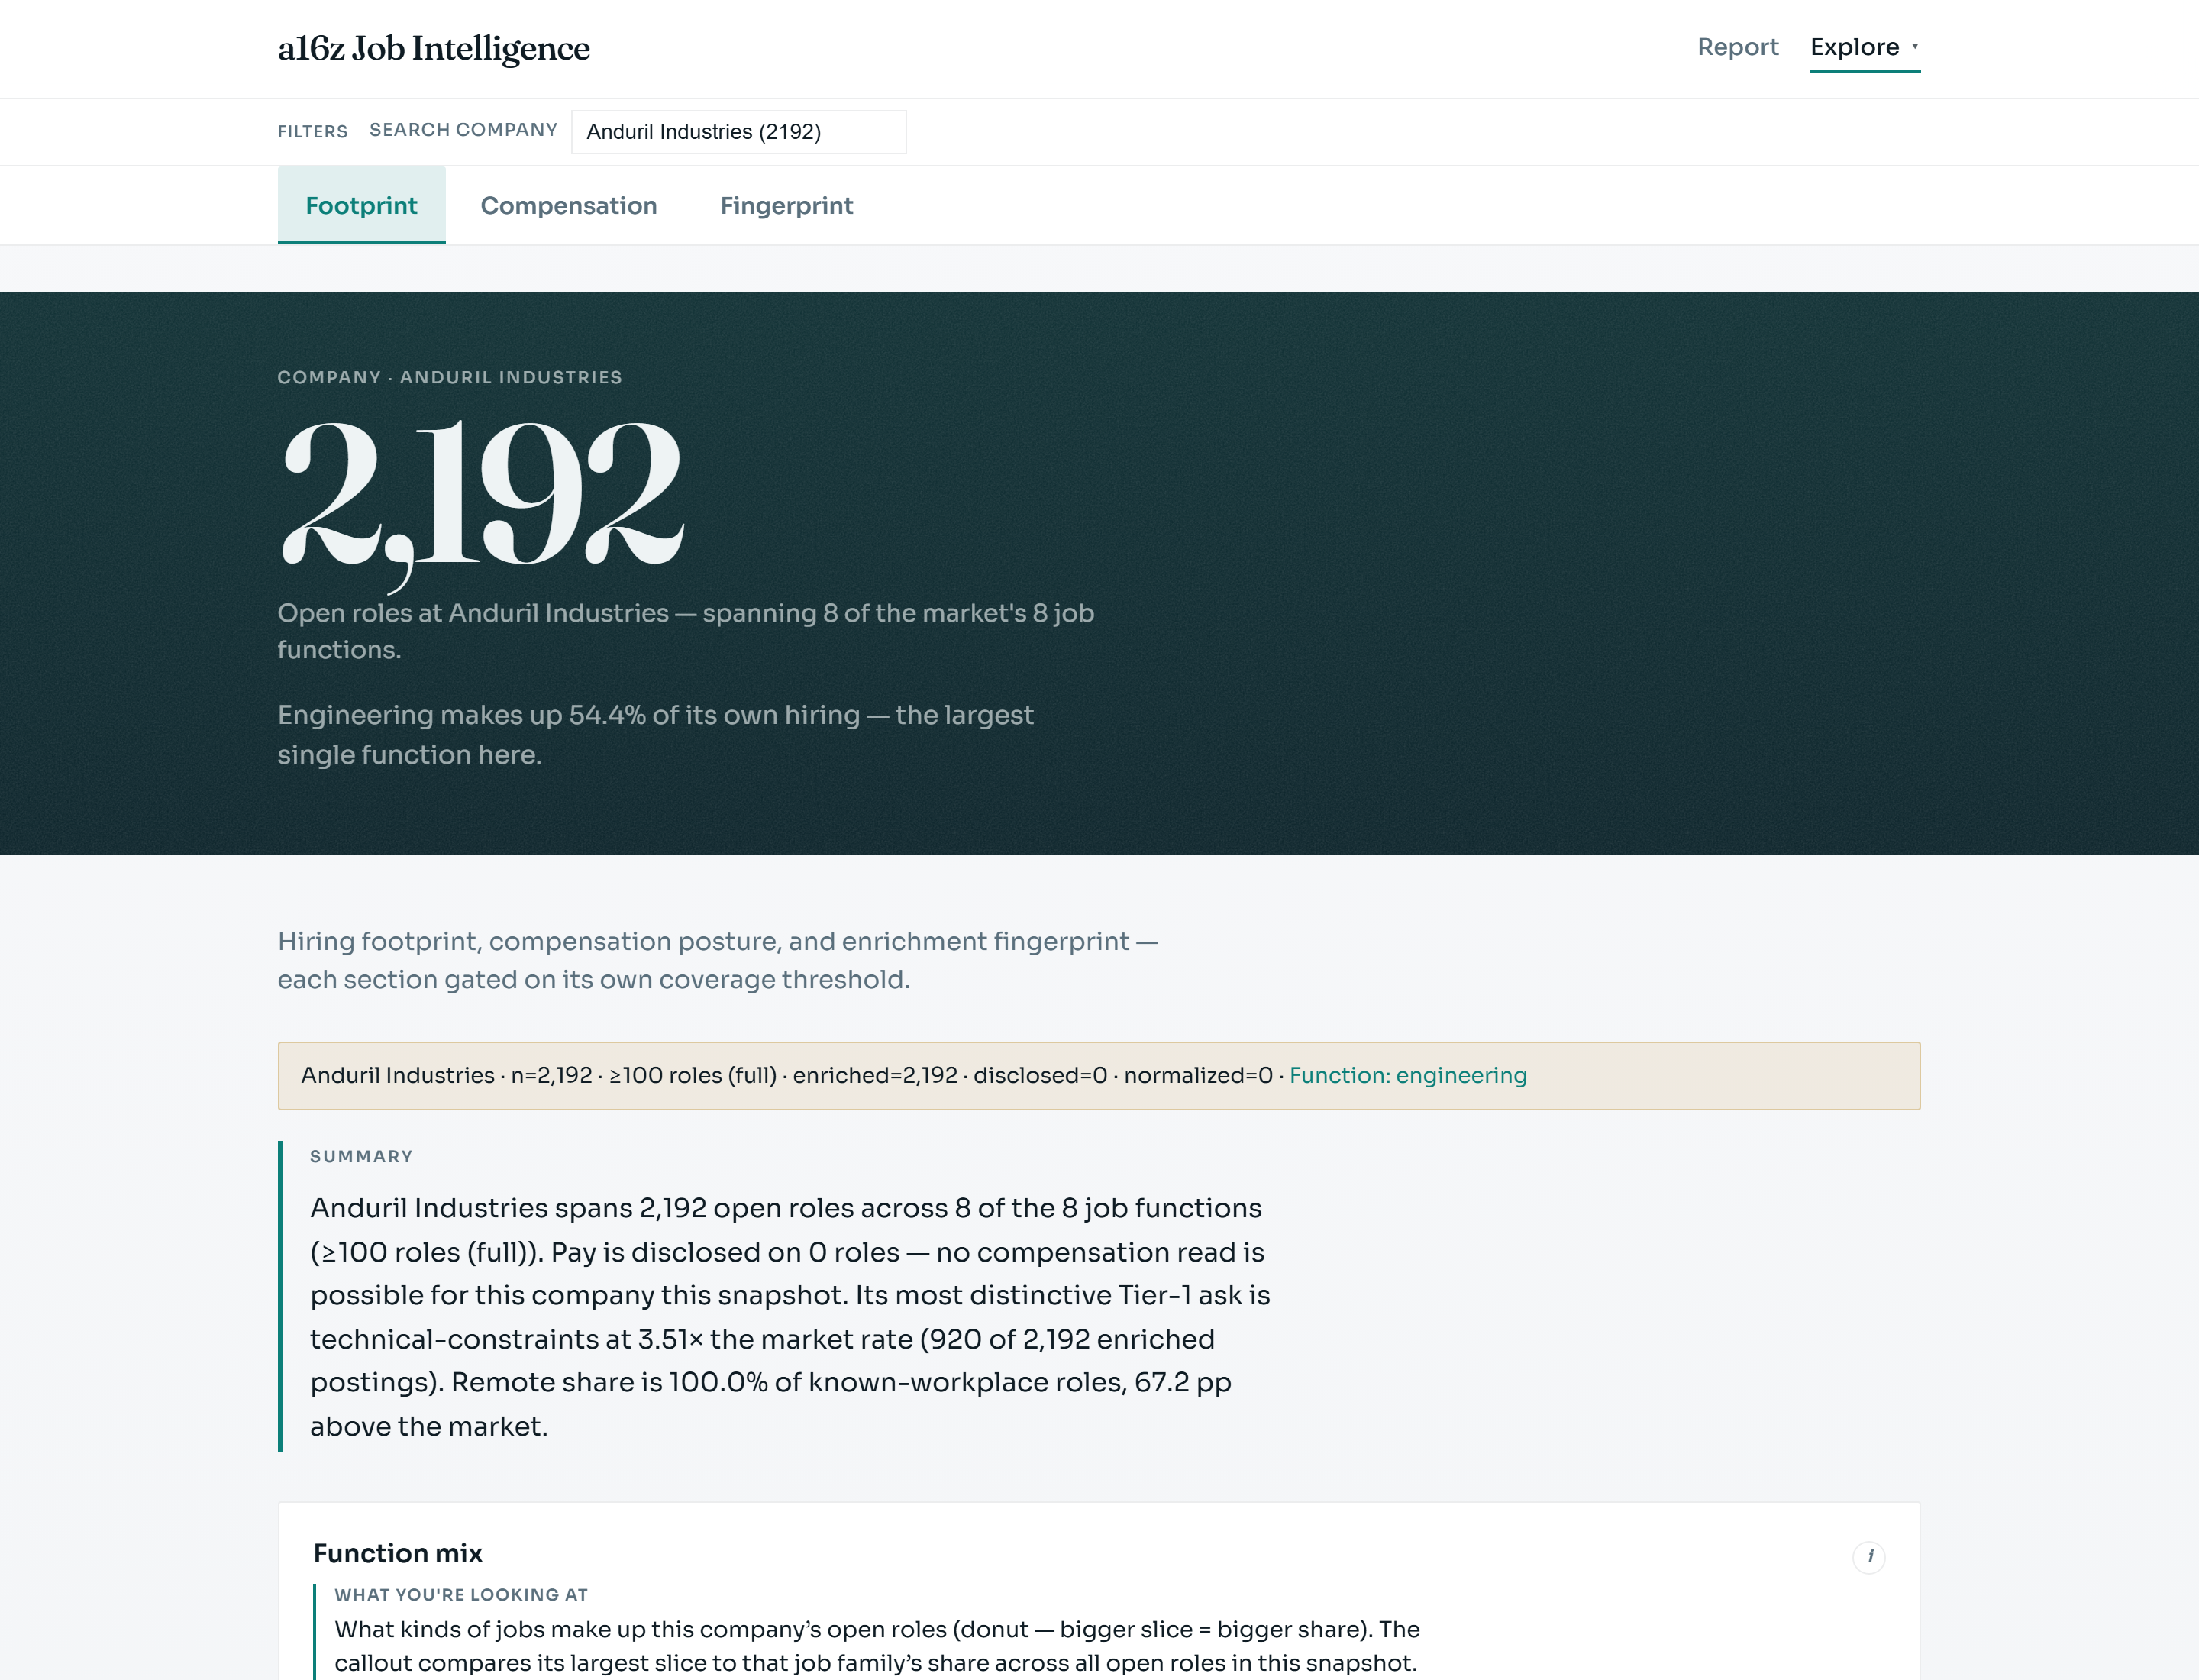
Product moment. Anduril has 2,192 roles and 2,192 enriched: Full Footprint and Full Fingerprint. Independently, it currently shows 0 disclosed compensation bands: Section B goes thin/audit/unavailable while Sections A and C stay rich. That is the independent-denominators principle made concrete: not a bug.
Three sections; each gated on its own sample-size threshold.
Section A: Hiring Footprint (by total roles)
| Widget | Notes |
|---|---|
| Compact company summary | Replaces charts when n < 30 |
| Company function mix | Donut + market callout (n ≥ 30) |
| Company locations & remote | Mosaic + remote vs market; HHI when large |
| Company seniority vs market | Paired 100% bars |
| Workplace & tier | Twin donuts |
Section B: Compensation Posture (by normalized disclosed)
| Widget | Notes |
|---|---|
| Comp by seniority: company vs market | Paired IQR boxes; needs ≥15 disclosed |
| Compensation unavailable / thin | Honest empty state |
| Disclosed roles audit | Raw table when disclosed < 15 |
| Disclosure by seniority: trust layer | Always when roles exist |
Section C: Hiring Fingerprint (by enriched count)
| Widget | Notes |
|---|---|
| Fingerprint pending / partial | 0 or 1–19 enriched |
| Distinctive skills / skill pairs | Lift vs prevalence bubble scatters |
| Distinctive signals / archetypes / gates / outcomes | Lift bars / lollipops |
| Score profile: company vs market | Radar |
| Lexical fingerprint | Titles + over-indexed JD terms (universal when possible) |
Layer 4: Role Intelligence
Question: what does this kind of job ask for, and where does it live: searched, not browsed.
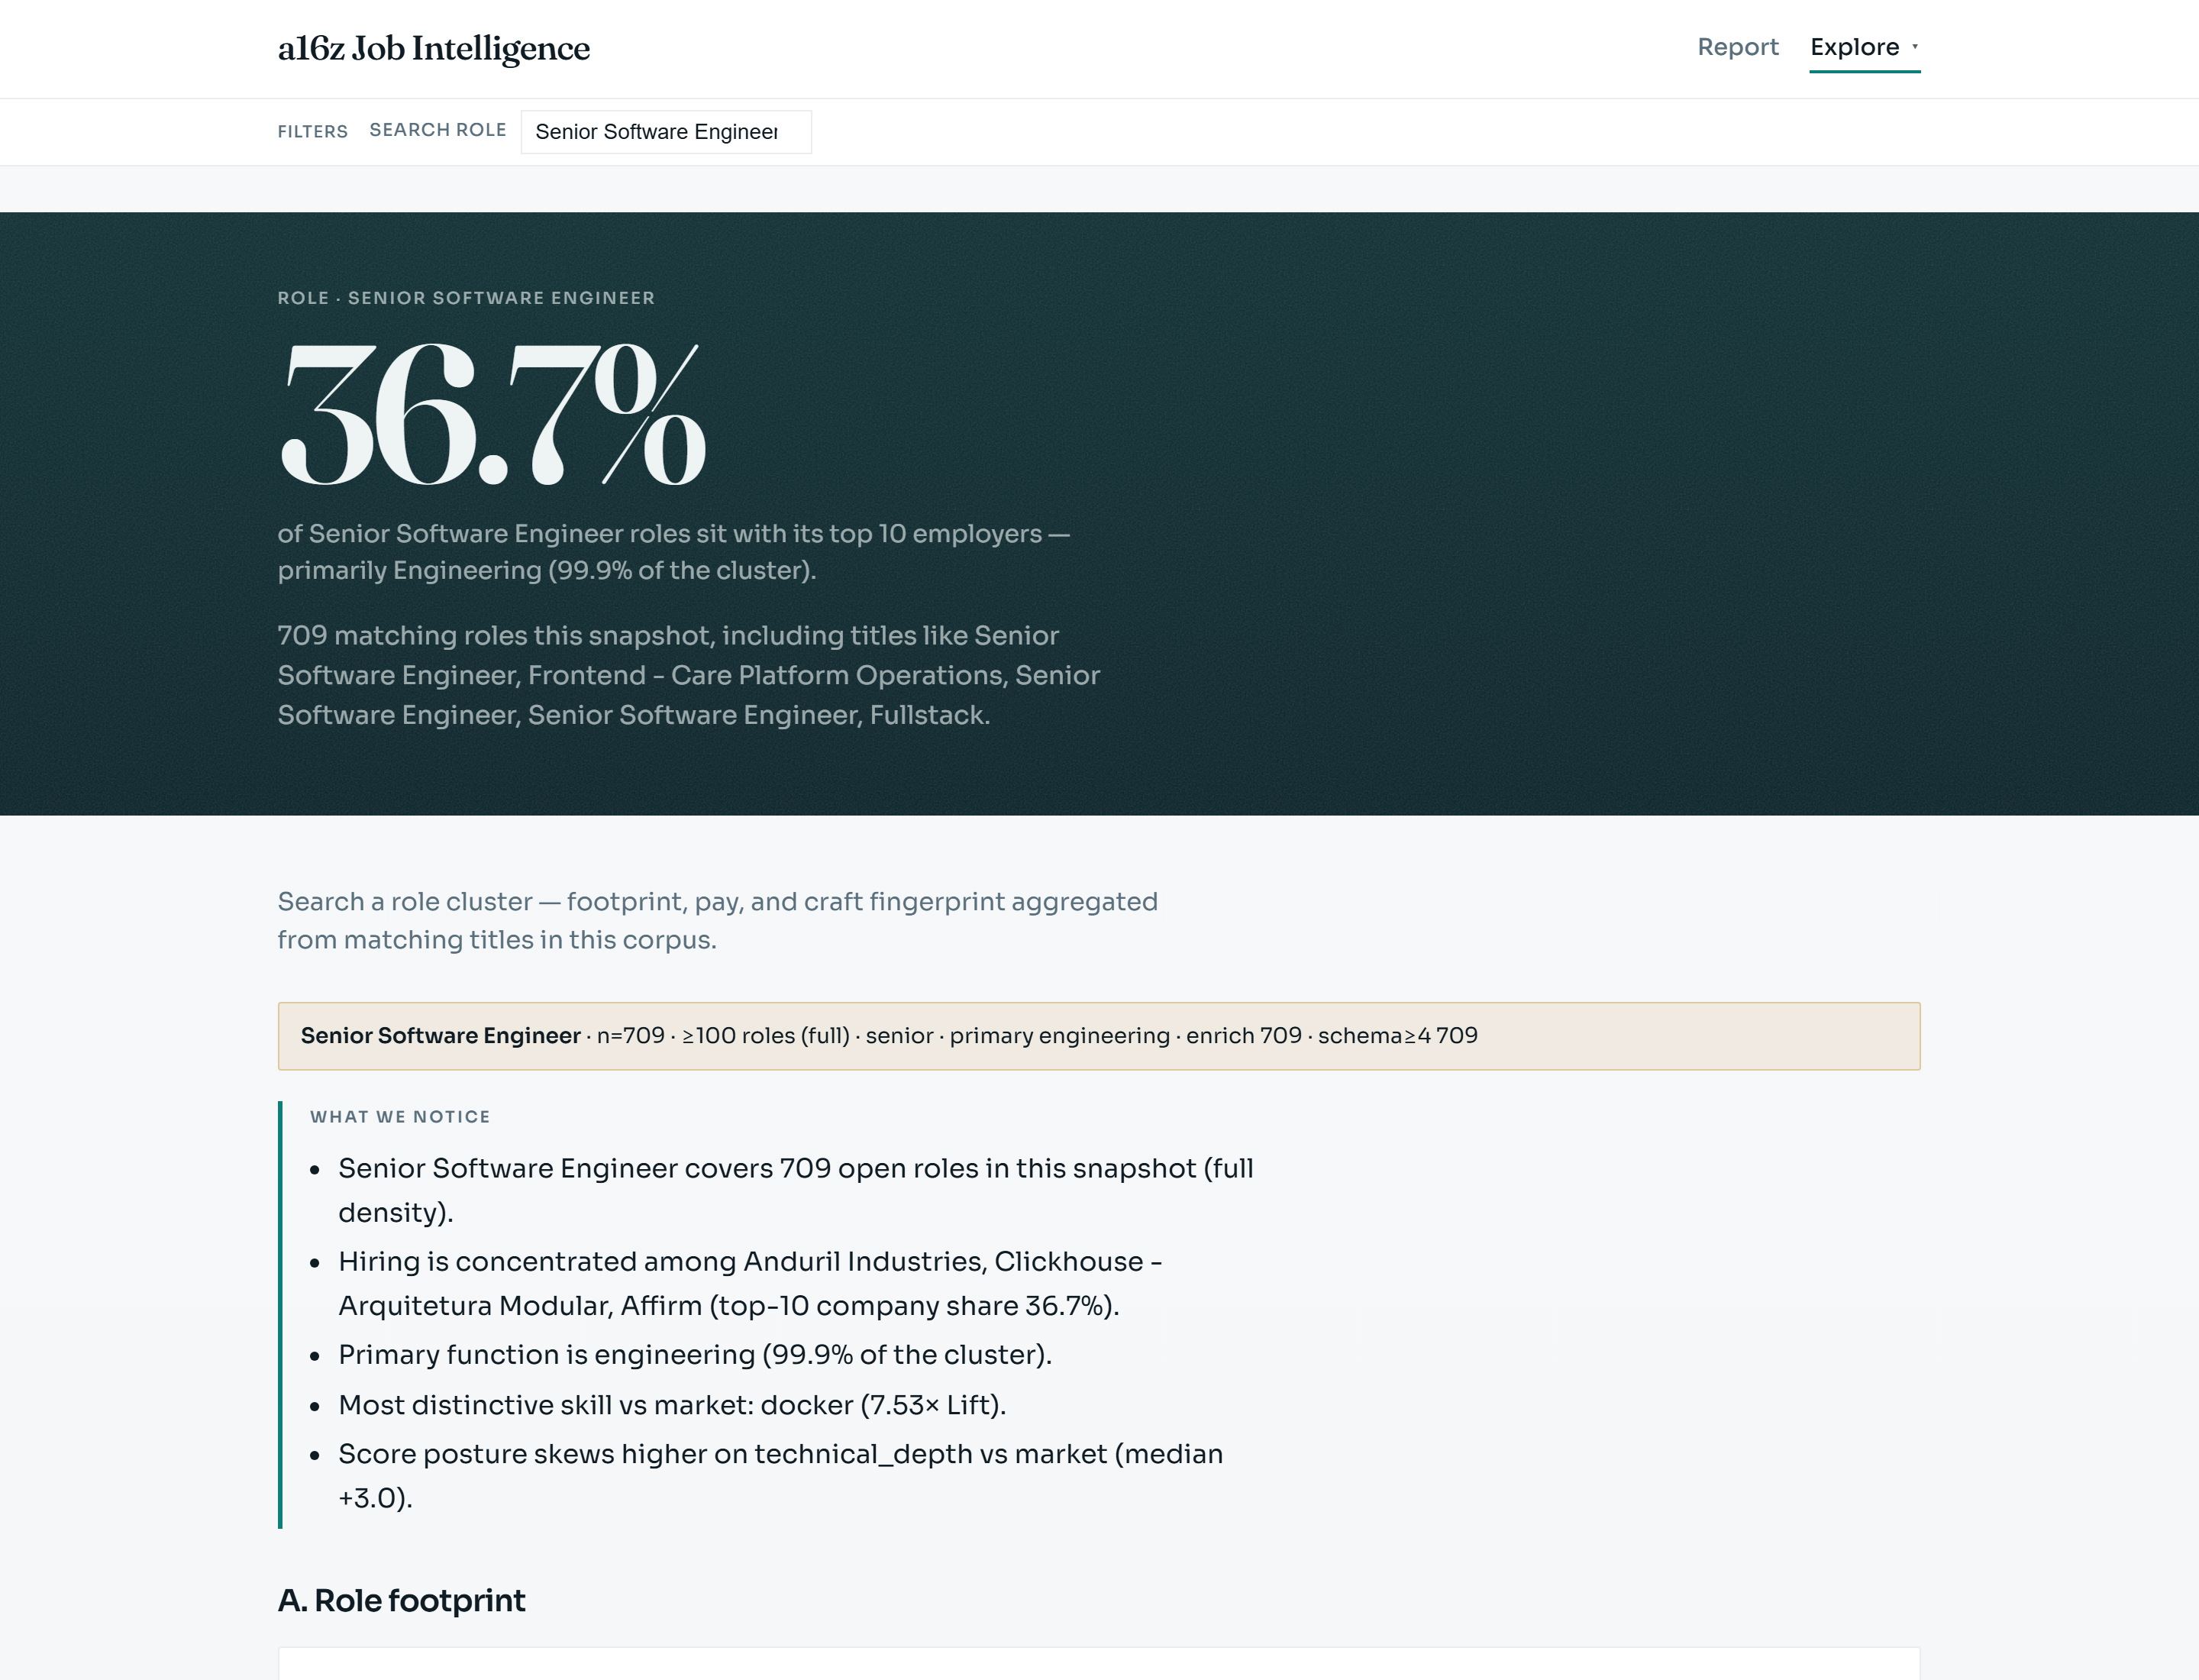
Raw titles are too noisy to compare (“Lifecycle Marketing Manger” sits next to “Product Marketing Lead”). Export builds role clusters; the page mirrors Company Intelligence so users learn one visual language:
| Section | Widgets (same grammar as Company) |
|---|---|
| A: Role Footprint | Compact (<30) · function mix · companies hiring · locations & remote · seniority & tier |
| B: Compensation | Paired boxes / thin / audit / disclosure trust layer |
| C: Role Fingerprint | Pending/partial · signal/skill/archetype/gate Lift · score radar · lexical titles |
Skills fingerprint prefers schema_version ≥ 4 (craft-true per-function vocab).
6b. What the market says
Single capture: composition and comparison, not velocity. Every number below is from the live packs behind the briefing.
Scale and honesty
[Pulse →](https://a16z-job-intelligence.majidm.com/market/pulse.html)
- 34,560 jobs
- 2,088 companies
- 30,799 enriched (89.1%)
- 3,761 (10.9%) enrichment ceiling (no JD at source: concentrated in other and engineering)
- 12,362 disclose pay (35.8%)
- overall normalized median $170,000 on that disclosed minority (Q1 $115k / Q3 $222.5k).
Where demand sits
[Structure →](https://a16z-job-intelligence.majidm.com/market/structure.html)
- Engineering 10,164 (29.4%) vs an even 12.5% eight-way split (~2.4×). Other 22.9% + operations 19.7% ≈ 43% of the board. Product and research ~3% each. Seniority is dominated by residual unspecified (48.5%); named senior is 20.2%. Of roles with a known workplace type, remote is 32.8%: not a remote-default market.
Network posture
- Universe 52.0%
- a16z 30.5%
- market 17.1%
- speedrun 0.4%. Network intensity 69.1% = share of roles outside a16z+speedrun (universe + market). Stealth flags are essentially absent (1 posting).
Pay and disclosure as signal
[Compensation →](https://a16z-job-intelligence.majidm.com/market/compensation.html)
- Function medians (disclosed/normalized): research $225k, product $211k, engineering $200k, design $175k, sales $167.5k, marketing $160k, operations $140k, other $125k. Disclosure by tier: universe 45.2%, a16z 37.8%, speedrun 31.3%, market tier 3.4%. By seniority: founding 70.7% high; intern 5.8% / junior 6.6% starve the charts. Plottable a16z-vs-market premiums only where both sides have density: junior +53.3%, intern −17.1%: senior/staff/exec often cannot be compared honestly yet.
What postings ask for
[Signals →](https://a16z-job-intelligence.majidm.com/market/signals.html)
- Behavioral rates on enriched ads: high-ownership 94.4%, ambiguity-tolerance 65.6%, hands-on 49.7%, execution-intensity 44.0%. Hard gates: location 83.3%, domain-expertise 43.3%, technical-depth 23.5%, security-clearance 11.7%. Archetypes: enterprise 33%, infrastructure 30%, ai-product 27%. Score medians (0–10): technical 5, commercial 3, management 0, AI 3.
Who is hiring across the stack
[Anomalies → Battlegrounds](https://a16z-job-intelligence.majidm.com/market/anomalies.html)
- Anduril 2,192 roles / 8 functions
- TikTok 1,045 / 8
- OpenAI 782 / 8
- Shield AI 434 / 7
- Datadog 402 / 8.
Two fingerprints
Anduril: 2,192 roles, 100% enriched, 0% pay disclosure. Defense-domain Lift 8.05×, security-clearance 7.48×, Rust 5.03×, embedded 4.33×; ai-product under-indexed at 0.26×.
Senior Software Engineer: 709 roles, disclosure 37.9%, median ~$198,900 (vs market senior ~$175,875). Skill Lift: Docker 7.53×, PostgreSQL 7.47×, React 7.13×, Kubernetes 6.41×. Technical-depth median 8 vs market 5.
7. Act VI: The architecture behind the four layers (no “tons of files”)
This is the engineering climax, and it’s a direct payoff of the split made almost accidentally back in Act I.
The hard constraint: never ship the raw, per-job warehouse files into the public-facing product. Only pre-baked aggregate packs: tens to low hundreds of files, not tens of thousands.
flowchart LR
    subgraph ops["Ops warehouse (private, file-heavy)"]
        J["Raw job descriptions\n(34,560 files)"]
        En["Per-job enrichment\n(~30,800 files)"]
        Agg["Warehouse-wide\nrollups"]
    end
    subgraph static["Public deliverable (curated)"]
        M["Overall Dashboard pack"]
        F["Function Intelligence packs\n(8: one per function)"]
        C["Company Intelligence packs\n(index + full profiles\nfor n>=30 only)"]
        R["Role Intelligence packs"]
    end
    J --> Agg
    En --> Agg
    Agg -->|"export pipeline"| M
    Agg --> F
    Agg --> C
    Agg --> R

    style ops fill:#3f3f46,color:#fff
    style static fill:#065f46,color:#fff
The public site is plain HTML/CSS/JS: no build step, no server, no database at read time: with meta.json, market.json, eight function packs, and Company/Role split into a thin searchable index plus full profile packs only for entities with n ≥ 30. Below that floor, the template loads a compact index entry and never shows empty chart frames.
One deliberate exception to “only aggregates”: market-filter-index.json: a near-row-level, dictionary-encoded pack so interactive Market filters can recompute statistics that are not additive under subsetting (KDE, HHI, Tukey fences). Still export-generated. Still no raw JDs. Still no live warehouse at runtime.
Each new snapshot, the warehouse is re-aggregated and re-exported into those packs; readers use the briefing site, not the pipeline. Raw notes stay in the newsroom. The brief that goes out the door is curated and pre-verified against sample-size floors.
What this actually proves
The product that came out of this is not a dashboard. It’s a briefing: read it here: built on top of a public catalog that still looks like a job board: speedrun-talent-network.com/jobs.
What generalized
- Council + adversarial CDO: analysts optimize for insight density; one reviewer optimizes for what to cut; consensus is not evidence. ChatGPT’s invented fields and Claude/Grok’s Lift-floor catches only show up if you run that loop.
- Ops warehouse vs static deliverable: volume forces the split; treating export as editorial work keeps the public surface honest.
- Shared grammar: Lift, density tiers, fingerprint tiers, comp floors, synthesis-first,
n=on every chart: so four layers feel like one product.
What I’d change
Pilot QA and per-function skills vocab on day one, before multi-function spend. Batch APIs for volume as soon as local proves the schema (~20s/job is not a scale path). CDO-review of live pages sooner: specs alone don’t reveal queued functions or a polar-area chart that fails Cleveland–McGill.
What it shows, depending on who you are
The full findings live in §6b. In short:
Recruiter / talent partner. Battlegrounds name who is hiring across all eight crafts this snapshot (Anduril → Datadog). Company Fingerprint turns “many reqs” into clearance/defense/Rust-shaped demand. Structure shows eng at ~29% and ops+other at ~43%: desks that only cover product+eng miss most headcount.
Applicant. Role clusters (e.g. Senior SWE) give a disclosed median when it exists (~$199k here) and refuse to invent one when it doesn’t. Skill Lift and score profiles say what the ads actually select for (cloud-native stack, technical depth 8 vs market 5) versus cultural wallpaper (high-ownership at 94%).
Founder / hiring manager. $170k median is drawn from 35.8% of ads; disclosure by tier (45% → 3.4%) is competitive posture. Plottable premiums are sparse. Eng Function Signals (~3.2× on Python/AWS/K8s) show how under-specified “rockstar” copy looks against this market.
Builder of similar products. Taxonomy beats model choice. Sample-size gates beat prettier charts. Per-job writes beat monoliths. Aggregate packs beat shipping the warehouse. Match chart encoding to variance shape. The §5b mistakes are the ones that don’t show up in a happy-path architecture diagram.
Close the loop
The gap I started with: catalog vs. intelligence: isn’t unique to job postings. Any large, structured corpus with thin enrichment coverage and uneven disclosure faces the same problem. The process generalizes. The grammar generalizes. The discipline of not shipping what you can’t stand behind at the sample size you actually have: that generalizes most of all.